Marktgröße und Wachstumsprognose für industrielle Schutzschuhe 2026–2035, nach Segmenten (Produkt, Endverwendung), regionalen Nachfragetrends (Nordamerika, Asien-Pazifik, Europa), wichtigen Ländereinblicken (USA, Japan, Südkorea, Deutschland, Frankreich, Italien) und Wettbewerbslandschaft
Market Size and Growoth Outlook
Electric Bus Charging Infrastructure Market size is projected to grow steadily from USD 3.81 billion in 2025 to USD 35.48 billion by 2035, demonstrating a CAGR exceeding 25% through the forecast period (2026-2035). The 2026 revenue is estimated at USD 4.68 billion.
Get more details on this report
Request Free Sample ReportMarkt für industrielle Schutzschuhe Intelligence Snapshot
Regionale Marktdynamik
Segmentdynamik
Treiber der Marktexpansion
Führende Marktteilnehmer
Global Market Forecast Snapshot
Marktausblick
Regionaler und segmentbezogener Ausblick
Marktwachstumstreiber und Branchentrends
The accelerated shift towards electrifying public transport fleets is a critical catalyst for the electric bus charging infrastructure market. Municipalities globally are replacing diesel buses with electric models, prompted by urban air quality concerns and operational cost savings. For example, the Los Angeles County Metropolitan Transportation Authority (LACMTA) announced plans to transition its entire bus fleet to electric by 2030, necessitating extensive charging infrastructure deployment. This trend drives demand for scalable, high-capacity charging solutions that support fleet operational efficiency. Both established manufacturers and new technology providers can capitalize on this by innovating fast-charging hardware and dynamic energy management systems tailored for transit operations. As fleet electrification deepens, integration with smart grid technologies will become crucial, ensuring reliable energy supply and optimized charging schedules.
Government Funding for EV Charging Infrastructure
Substantial government investment has emerged as a pivotal growth driver for the electric bus charging infrastructure market. National and regional authorities, such as the European Commission under its Green Deal initiative, are dedicating billions in grants and subsidies to accelerate EV infrastructure deployment, recognizing it as essential for meeting climate commitments. Funding availability lowers entry barriers and stimulates infrastructure expansion, influencing competitive dynamics by enabling startups to collaborate with public transport agencies on pilot projects. Established energy utilities and charging network operators gain a clear pathway for scaling operations with reduced financial risk. Persistent public funding signals continued prioritization of clean mobility solutions, embedding infrastructure upgrades into urban planning and transit system modernization.
Long-Term Urban Decarbonization and Net-Zero Targets
The electric bus charging infrastructure market is increasingly shaped by cities and governments aligning transport strategies with net-zero emissions goals. Urban authorities like Singapore’s Land Transport Authority have integrated electric bus mandates into broader decarbonization roadmaps, reinforcing demand for extensive charging networks. This driver reflects a systemic shift toward sustainable urban mobility, influencing not only infrastructure but also vehicle design, power sourcing, and service models. For players in the market, it offers opportunities to develop integrated solutions combining renewable energy, vehicle-to-grid technologies, and data analytics to support carbon-neutral transit ecosystems. These strategic imperatives are solidifying electric bus charging infrastructure as an indispensable element in holistic urban climate strategies, securing its role in future public transportation frameworks.
Industry Restraints:
High Capital Expenditure and Infrastructure Costs
The significant upfront investment required for establishing electric bus charging infrastructure remains a key obstacle to market growth. Charging stations demand substantial financial outlays for high-capacity grid connections, advanced hardware, and site development, often exceeding budgets of transit agencies and municipal operators. For instance, the U.S. Department of Energy highlights that installation costs can be prohibitive compared to conventional fuel stations, slowing adoption in cost-sensitive regions. This financial barrier constrains market participants from scaling deployment rapidly and challenges newcomers lacking deep capital reserves. Long-term operational savings are often outweighed by initial funding gaps, delaying decision-making. Going forward, capital intensity will likely continue limiting smaller operators, favoring large, well-funded players capable of securing grants or partnerships, until cost reduction technologies and financing models mature.
Grid Capacity Limitations and Regulatory Hurdles
Electric bus charging infrastructure expansion is frequently hampered by insufficient local grid capacity and complex regulatory approval processes. Rapid scaling strains electricity networks, necessitating costly upgrades and time-consuming coordination with utilities and authorities. The California Energy Commission reports that grid modernization delays have postponed multiple charging projects, reflecting broader challenges in integrating high-demand chargers in urban centers. Regulatory complexity, including varying permitting standards between jurisdictions, adds layers of uncertainty and compliance costs for operators. This environment restricts market entrants and established firms alike, complicating deployment timelines and increasing execution risk. In the medium term, unless streamlined regulatory frameworks and grid enhancements accelerate, infrastructure growth will progress unevenly, privileging regions with proactive policy support and robust grid resilience.
| Wachstumstreiber | Auswirkung auf CAGR | Regulatorischer Einfluss | Geografische Relevanz | Adoptionsrate | Zeitrahmen der Auswirkungen |
|---|---|---|---|---|---|
| Schnelle Elektrifizierung der öffentlichen Verkehrsflotten | 6.50% | Kurzfristig (≤ 2 Jahre) | Asien-Pazifik, Europa; Auswirkungen: Nordamerika | Hoch | Schnell |
| Staatliche Förderung der Ladeinfrastruktur für Elektrofahrzeuge | 5.80% | Mittelfristig (2–5 Jahre) | Europa, Asien-Pazifik; Auswirkungen: Lateinamerika | Hoch | Mäßig |
| Langfristige Ziele für die Dekarbonisierung von Städten und die Erreichung von Netto-Null-Emissionen | 4.70% | Langfristig (5+ Jahre) | Global; Spillover-Effekt: Naher Osten und Afrika | Hoch | Mäßig |
| Schnelle Elektrifizierung der öffentlichen Verkehrsflotten | 6.50% | Kurzfristig (≤ 2 Jahre) | Asien-Pazifik, Europa; Auswirkungen: Nordamerika | Hoch | Schnell |
| Staatliche Förderung der Ladeinfrastruktur für Elektrofahrzeuge | 5.80% | Mittelfristig (2–5 Jahre) | Europa, Asien-Pazifik; Auswirkungen: Lateinamerika | Hoch | Mäßig |
| Langfristige Ziele für die Dekarbonisierung von Städten und die Erreichung von Netto-Null-Emissionen | 4.70% | Langfristig (5+ Jahre) | Global; Spillover-Effekt: Naher Osten und Afrika | Hoch | Mäßig |
Unlock insights tailored to your business with our bespoke market research solutions.
Click to get your customized report now.
Regionale Nachfragedynamik
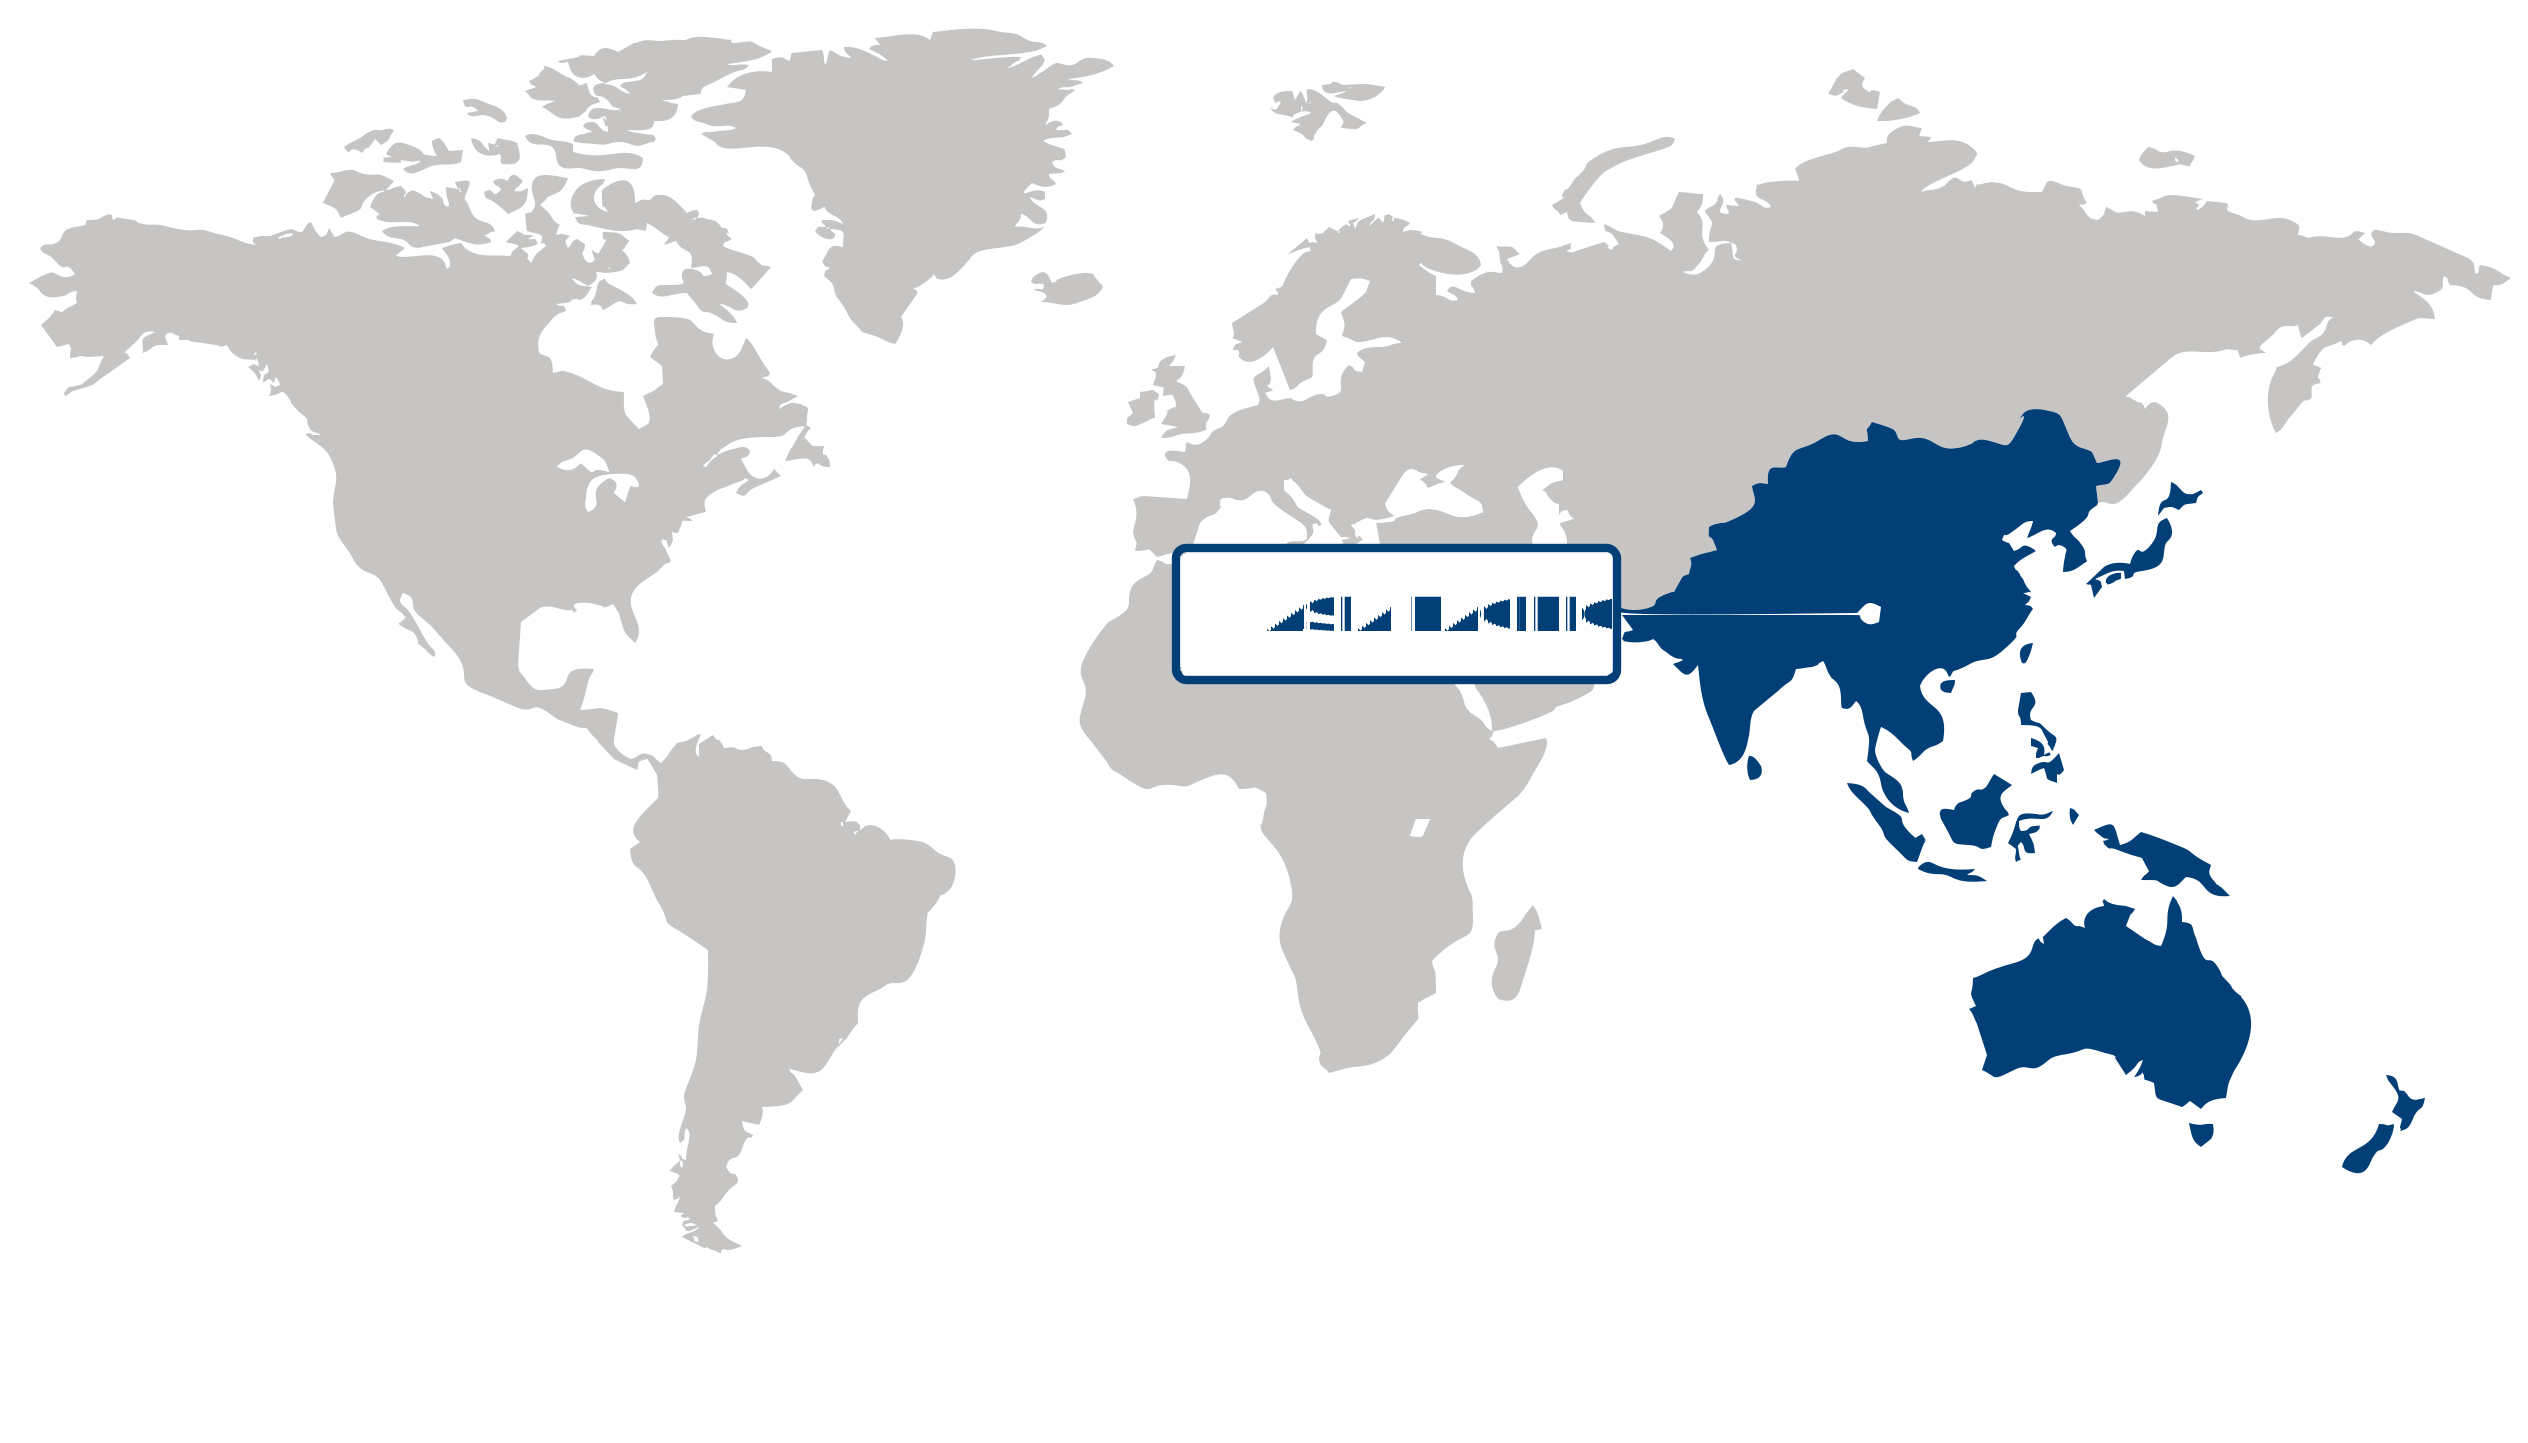
Asia Pacific dominated the electric bus charging infrastructure market in 2025, capturing approximately 45% of the global share and boasting the fastest growth with a CAGR of 27.6%. This leadership stems from extensive electric bus deployment programs supported by substantial government investments in charging infrastructure, particularly in urban centers prioritizing clean energy transport. For instance, China’s National Energy Administration has accelerated large-scale charging station rollouts, complementing massive fleet electrification. Additionally, countries in the region have prioritized sustainable transit solutions amid rising urbanization and environmental concerns, driving a swift evolution in charging technology and network expansions. The region’s blend of active regulatory frameworks and innovative operational models underscores its resilience and competitive intensity. With continued digital advancements and policy support, Asia Pacific presents robust opportunities for investors in the electric bus charging infrastructure market, as expanding public transport electrification remains a critical regional priority.
Japan plays a pivotal role in Asia Pacific’s electric bus charging infrastructure market, underpinned by its advanced technological capabilities and comprehensive government subsidies for clean transport solutions. The Ministry of Land, Infrastructure, Transport and Tourism (MLIT) has launched pilot programs encouraging smart charging infrastructure integration, reflecting a strategic focus on efficient, reliable electric bus systems. This has catalyzed innovations in fast-charging and battery management, positioning Japan as a hub for next-generation charging technologies. These advancements not only cater to rising domestic demand but also enhance regional supply chains, reinforcing Asia Pacific’s leadership.
China anchors the electric bus charging infrastructure market in Asia Pacific through massive city-wide deployment plans and aggressive infrastructure investing by bodies like the China Electric Vehicle Charging Infrastructure Promotion Alliance. Its vast urban transport electrification initiatives, highlighted by Shanghai and Shenzhen’s expanded charging networks, meet growing emission reduction targets while reshaping public transport fleets. This scale and governmental resolve provide a blueprint for other countries in the region, consolidating China’s strategic dominance and driving broader regional market expansion. Together with Japan, China’s concerted efforts significantly elevate the Asia Pacific market’s investment appeal.
Europe Market Analysis:
Europe emerged as the fastest-growing region in the electric bus charging infrastructure market, registering a robust CAGR of 28.4%. This rapid expansion is primarily driven by stringent environmental regulations and aggressive decarbonization policies across the continent, propelling demand for sustainable urban transit solutions. The European Union’s comprehensive Green Deal and the Fit for 55 package have intensified investments in charging networks, aligning with urban mobility shifts and consumer preferences favoring electric public transportation. Leading transport authorities, such as Transport for London and Paris’s RATP Group, are accelerating deployment of charging infrastructure to support growing electric bus fleets. Additionally, advancements in smart grid integration and operational technology optimize energy consumption and reduce operational costs. Europe’s resilient economic frameworks and established industrial expertise position it to capitalize on the increasing adoption of electric buses, offering significant long-term opportunities for infrastructure developers and investors.
Germany plays a pivotal role in Europe’s electric bus charging infrastructure market by leveraging its advanced manufacturing sector and government incentives. The German federal government’s Climate Protection Program 2030 includes substantial subsidies aimed at electrifying public transport and building an extensive charging network. Transport operators such as Berliner Verkehrsbetriebe (BVG) have accelerated fleet electrification, driving demand for reliable, high-capacity charging stations. Germany’s digital infrastructure facilitates smart charging solutions, enhancing grid stability as electric bus adoption rises. Furthermore, collaborations between industry leaders like Siemens and Daimler focus on integrating fast-charging technology tailored to urban transit needs. This combination of policy support and technological innovation underscores Germany’s strategic importance in scaling Europe’s charging infrastructure market.
France’s electric bus charging infrastructure market growth reflects strong governmental commitment and increasing urban sustainability initiatives. The French government’s “Plan de Relance” mobilizes €30 billion toward green transportation, with a significant share allocated to electric bus infrastructure expansion. France’s transport operators, including RATP and Keolis, actively transition their fleets, creating demand for interoperable, scalable charging solutions. The country’s focus on regional sustainability aligns with the EU’s broader climate targets, complemented by advancements in battery technology and energy management from companies like Schneider Electric. France's urban demographic trends, characterized by increasing public transit ridership and environmental awareness, further stimulate infrastructure investments. This strategic focus reinforces France's contribution to Europe's leadership in the electric bus charging infrastructure market, presenting compelling opportunities for stakeholders aiming to capitalize on green transit transformation.
North America Market Trends:
North America maintained notable presence in the electric bus charging infrastructure market, driven by increasing investments in clean transit solutions and expanding urban electrification programs. The region’s emphasis on reducing carbon emissions and stringent emission regulations from authorities like the U.S. Environmental Protection Agency has accelerated demand shifts toward electric public transportation. Leading technology providers such as Proterra and ChargePoint are advancing fast-charging networks, reflecting operational improvements and heightened competitive intensity. Additionally, federal incentives under the U.S. Bipartisan Infrastructure Law and state-level initiatives in California are reshaping spending patterns and accelerating infrastructure deployment. These dynamics, combined with a growing workforce skilled in EV technologies and robust supply chains, signify that North America is poised for significant expansion, presenting strategic growth opportunities for investors looking to capitalize on the transition to sustainable urban mobility.
The U.S. serves as the cornerstone of North America’s electric bus charging infrastructure market, benefiting from strong governmental backing and a sophisticated technological ecosystem. The Federal Transit Administration's Low or No Emission Vehicle Program has fueled adoption by providing substantial grants to transit agencies for deploying electric buses and chargers. Corporate players like Blink Charging have expanded their footprints with innovative smart charging solutions, responding to escalating consumer preference for green transit options. Furthermore, heightened collaboration between public and private sectors has fostered deployment efficiency amid rising environmental awareness among urban commuters, illustrating the country’s leadership in integrating charging infrastructure within comprehensive urban planning. Such developments underscore the U.S.’s pivotal role in advancing regional market maturity and highlight its strategic significance for fueling broader North American growth.
| Parameter | Nordamerika | Asien-Pazifik | Europa | Lateinamerika | Nahost und Afrika |
|---|---|---|---|---|---|
| Innovationszentrum i Skala Entstehend Entwickelt sich Fortgeschritten | |||||
| Kostensensibilität der Region i Skala Niedrig Mittel Hoch | |||||
| Regulatorisches Umfeld i Skala Restriktiv Neutral Unterstützend | |||||
| Nachfragetreiber i Skala Schwach Moderat Stark | |||||
| Entwicklungsstand i Skala Aufstrebend Entwickelt sich Entwickelt | |||||
| Adoptionsrate i Skala Niedrig Mittel Hoch | |||||
| Neue Marktteilnehmer / Start-ups i Skala Gering Moderat Hoch | |||||
| Makroökonomische Indikatoren i Skala Schwach Stabil Stark |
Segment Leadership and Growth Trends
Markt für industrielle Schutzschuhe Share (%), Ladegerät-Typ,
Go beyond the chart, access full insights & data tables
Kostenlosen Musterbericht anfordernPantograph held the largest share in the electric bus charging infrastructure market in 2025, driven primarily by the accelerating electrification of public bus fleets and stringent government mandates promoting sustainable transit solutions. This segment’s leadership reflects transit authorities’ preference for its rapid, high-power charging capabilities, which align with evolving urban mobility models emphasizing efficiency and reduced environmental impact. Leading manufacturers like ABB and Siemens have showcased robust pantograph solutions endorsed by European Union regulatory bodies, signaling strong institutional support. Such developments position pantograph charging as a strategic asset for both established energy companies and innovative startups aiming to capitalize on expanding public transportation electrification projects. Given continual investments in green infrastructure and emission reduction targets globally, pantograph chargers are expected to retain their prominence as a foundational technology within the electric bus charging ecosystem.
Analysis by Charging Method
Fast charging represented the largest share in the electric bus charging infrastructure market in 2025, propelled by transit agencies’ demand for minimizing vehicle downtime and enhancing operational flexibility. Fast charging technology supports high-frequency route schedules and tight turnaround times, which are increasingly critical in densely populated urban centers where public transit demand is surging. Prominent operators such as the Los Angeles Metropolitan Transportation Authority have publicly adopted fast charging systems to maintain service consistency and reduce fleet idling. Additionally, digital integration of fast chargers with fleet management software underscores broader trends in transportation digitization and predictive maintenance. This segment offers a compelling opportunity for established suppliers to expand modular fast charger deployments while enabling new entrants to innovate around user-centric and data-driven charging solutions. As cities prioritize resilience and service efficiency, fast charging will continue to be a key enabler of sustainable and agile public transport networks.
| Segment | Untersegment | Größtes Segment | Am schnellsten wachsend |
|---|---|---|---|
| Ladegerät-Typ | Gleichstromladegerät, Stromabnehmer | ||
| Ladeverfahren | Schnellladen, Langsames Laden |
Wettbewerbslandschaft und Marktpositionierung
The competitive landscape is marked by robust collaboration and rapid technology development. These companies continually refine charging technology, enhancing charging speed, interoperability, and grid integration features. Several have expanded their capabilities through strategic partnerships that combine hardware manufacturing with software and services, facilitating turnkey solutions tailored to varied transit needs. Market leaders actively invest in next-generation charging systems, including ultra-fast and wireless options, to differentiate offerings. The consolidation trends and cross-industry alliances allow them to optimize supply chains and accelerate adoption in key urban centers. This dynamic fosters a technologically intensive environment where agility in introducing advanced, flexible charging platforms is crucial to maintaining competitive advantage.
Strategic / Actionable Recommendations for Regional Players
In North America, firms could enhance competitiveness by partnering with transit agencies and technology providers to co-develop adaptive charging infrastructure that meets evolving regulatory standards while accommodating diverse fleet requirements. Prioritizing integration of smart grid functionalities and eco-friendly energy sources will position players to capture growing municipal investments.
In the Asia Pacific region, capitalizing on the rapid expansion of electric bus fleets demands a focus on scalable, cost-effective solutions. Collaborating with local battery manufacturers and leveraging IoT-enabled monitoring can streamline operations, while targeting emerging urban transit corridors will maximize impact amid intensifying competition.
European companies should further emphasize interoperability and standardization to align with stringent environmental policies. Alliances with renewable energy and grid operators can enable innovative demand-response charging models, thereby enhancing system resilience and appealing to sustainability-driven public and private customers.
| Unternehmen | Marktanteil | Unternehmensumsatz | Umsatz-CAGR (%) | Produktportfolio | Geografische Präsenz | Innovations- / F&E-Schwerpunkt | Strategische Entwicklungen |
|---|---|---|---|---|---|---|---|
| Keine Unternehmensdaten verfügbar. | |||||||
Branchenentwicklung/Nachrichten
| Unternehmensname | Datum | Wichtige Entwicklung |
|---|
Diesen Bericht erkunden
Klicken Sie auf einen Bereich des Rades oder die nummerierte Markierung, um individuelle Segmentierungen, ein individuelles Inhaltsverzeichnis oder verwandte Berichte anzuzeigen.
Markt für industrielle Schutzschuhe — Custom Segments
| Segment | Untersegment |
|---|---|
| Keine Segmentdaten verfügbar. | |
Markt für industrielle Schutzschuhe — report.custom
| Individuelles Kapitel | Individuelle Details | ||
|---|---|---|---|
| Keine Daten zum individuellen Inhaltsverzeichnis verfügbar. | |||
Benötigen Sie eine andere Datenauswertung?
Individuelle Recherche anfordernWie wird sich der Markt für Ladeinfrastruktur für Elektrobusse voraussichtlich in den nächsten 10 Jahren entwickeln?
Welche Region hat den größten Anteil am Marktwert der Ladeinfrastruktur für Elektrobusse?
Welche Region verzeichnete die höchste durchschnittliche jährliche Wachstumsrate (CAGR) im Bereich der Ladeinfrastruktur für Elektrobusse?
Wie schlägt sich das Segment der Stromabnehmer in der Ladeinfrastrukturbranche für Elektrobusse?
Welchen Anteil hat das Segment Schnellladen am Sektor der Ladeinfrastruktur für Elektrobusse im Jahr 2025?
Welche Organisationen gelten als führend im Bereich der Ladeinfrastruktur für Elektrobusse?
Unsere Kunden
"The reports offered a comprehensive view of the Food and Beverage landscape, covering market trends, consumer behavior, and competitive dynamics."
"Our experience in acquiring market research reports has been outstanding — the depth of analysis and actionable insights have proven invaluable."
"Fundamental Business Insights demonstrated a keen understanding of our business needs, delivering reports tailored to our specific objectives."
Unser Forschungsteam & unsere Methodik
Every Fundamental Business Insights report is built by a dedicated vertical research team, validated through a structured primary-and-secondary methodology, and reviewed for accuracy before it reaches you.
Delivery
Published
Demand
Available
Support
Trust & Compliance
Research Intelligence
| Quellenkategorie | Forschungsquellen | Zweck |
|---|---|---|
| Government Publications | Government agencies, statistical departments, regulatory bodies | Industry statistics, regulatory insights, and policy analysis |
| Company Disclosures | Annual reports, investor presentations, financial filings | Company performance, business strategy, and market positioning |
| Trade Associations | Industry associations and professional organizations | Industry developments, standards, and market perspectives |
| Technical Literature | Research papers, technical publications, academic journals | Technology developments and technical validation |
| Patent Analysis | Patent databases and intellectual property publications | Innovation trends, technology activity, and competitive research |
| Industry Databases | Established research databases and market intelligence resources | Market benchmarking, historical data, and industry analysis |
Forschungsworkflow & Qualitätssicherung
Datenerhebung
Verified information gathered through primary and secondary research.
Datentriangulation
Cross-validation using multiple independent data sources.
Prognosemodellierung
Market estimates developed using historical trends and analytical models.
Analystenvalidierung
Findings reviewed by domain experts for accuracy and consistency.
Redaktionelle & Qualitätsprüfung
Final editorial, quality, and compliance checks before publication.
Endgültige Veröffentlichung
Released after successful completion of the internal review process.
Berichtsabdeckung
📊 Marktbewertung
- Market Size & Forecast
- Market Segmentation
- Regional Analysis
- Growth Drivers & Challenges
- Marktdynamik
🏢 Wettbewerbsanalyse
- Wettbewerbslandschaft
- Company Profiles
- Competitive Benchmarking
- Mergers & Acquisitions
- Market Share Analysis or Key Company Strategies
🔍 Strategische Analyse
- Value Chain Analysis
- Porter's Five Forces
- PESTLE Analysis
- Pricing Trends
- Supply-Demand Analysis
🚀 Zukunftsausblick
- Technology Landscape
- Regulatory Landscape
- Investment & Funding Landscape
- Emerging Opportunities
- Future Market Outlook
Have a question about this report or need a custom scope?
Anpassung anfordern