Marktgröße und Prognosen für Überlandbusse 2026-2035, nach Segmenten (Bustyp, Sitzplatzkapazität, Kraftstoffart, Anwendung), Wachstumschancen, Innovationslandschaft, regulatorische Änderungen, strategische regionale Einblicke (USA, Japan, China, Südkorea, Großbritannien, Deutschland, Frankreich) und Wettbewerbsdynamik (Transdev, Keolis, Arriva, FirstGroup, Nobina)
Market Size and Growoth Outlook
Intercity Buses Market size stood at USD 92.58 Billion in 2026 and is predicted to grow at 8.48% CAGR from 2027 to 2036, surpassing USD 208.94 Billion by 2036. The industry revenue for 2027 is calculated at USD 99.25 Billion.
Get more details on this report
Request Free Sample ReportMarkt für Fernbusse Intelligence Snapshot
Regionale Marktdynamik
Segmentdynamik
Treiber der Marktexpansion
Führende Marktteilnehmer
Global Market Forecast Snapshot
Marktausblick
Regionaler und segmentbezogener Ausblick
Marktwachstumstreiber und Branchentrends
Rising infrastructure investments enhancing intercity road connectivity and fleet expansion
Ongoing investments in highways, expressways, and regional transportation corridors are improving the accessibility and efficiency of long-distance road travel across many countries. These developments will drive the intercity buses market growth by enabling operators to expand route networks, reduce travel times, and serve previously underserved destinations with greater reliability. Improved road infrastructure also supports the deployment of larger and more modern bus fleets while lowering vehicle wear, enhancing operational efficiency, and creating opportunities for transport providers to strengthen regional connectivity.
Cost-efficient mass mobility demand strengthening intercity bus utilization rates
As travelers increasingly seek economical transportation options for business, education, and leisure, bus services continue to offer an attractive balance between affordability and accessibility. The intercity buses market benefits from this shift because operators can accommodate large passenger volumes while maintaining competitive fares compared with alternative modes of long-distance transport. Strong demand for cost-effective mobility also encourages higher service frequency, optimized route planning, and expanded connectivity between urban centers and surrounding regions where public transportation options remain limited.
Growth of digital ticketing platforms improving intercity bus occupancy optimization
The adoption of digital booking platforms is transforming how passengers discover, compare, and reserve intercity travel services. Growth in online ticketing solutions will propel the intercity buses market growth by enabling operators to improve seat utilization through dynamic scheduling, simplified reservations, and real-time availability management. Integrated mobile applications, digital payment options, and automated customer communication also enhance the passenger experience while providing transport companies with valuable demand insights that support more efficient fleet allocation and route management.
| Wachstumstreiber | Auswirkung auf CAGR | Regulatorischer Einfluss | Geografische Relevanz | Adoptionsrate | Zeitrahmen der Auswirkungen |
|---|---|---|---|---|---|
| Zunehmende Urbanisierung und Nachfrage nach bezahlbarem Verkehr | 0.013 | Kurzfristig (≤ 2 Jahre) | Asien-Pazifik, Lateinamerika (Spillover: MEA) | Medium | Schnell |
| Regierungsinitiative für nachhaltige Überlandbusdienste | 0.01 | Mittelfristig (2–5 Jahre) | Europa, Asien-Pazifik (Auswirkungen: Nordamerika) | Hoch | Mäßig |
| Einführung von Elektro- und Hybrid-Fernbussen | 0.008 | Langfristig (5+ Jahre) | Nordamerika, Europa (Auswirkungen: Asien-Pazifik) | Hoch | Langsam |
Unlock insights tailored to your business with our bespoke market research solutions.
Click to get your customized report now.
Regionale Nachfragedynamik
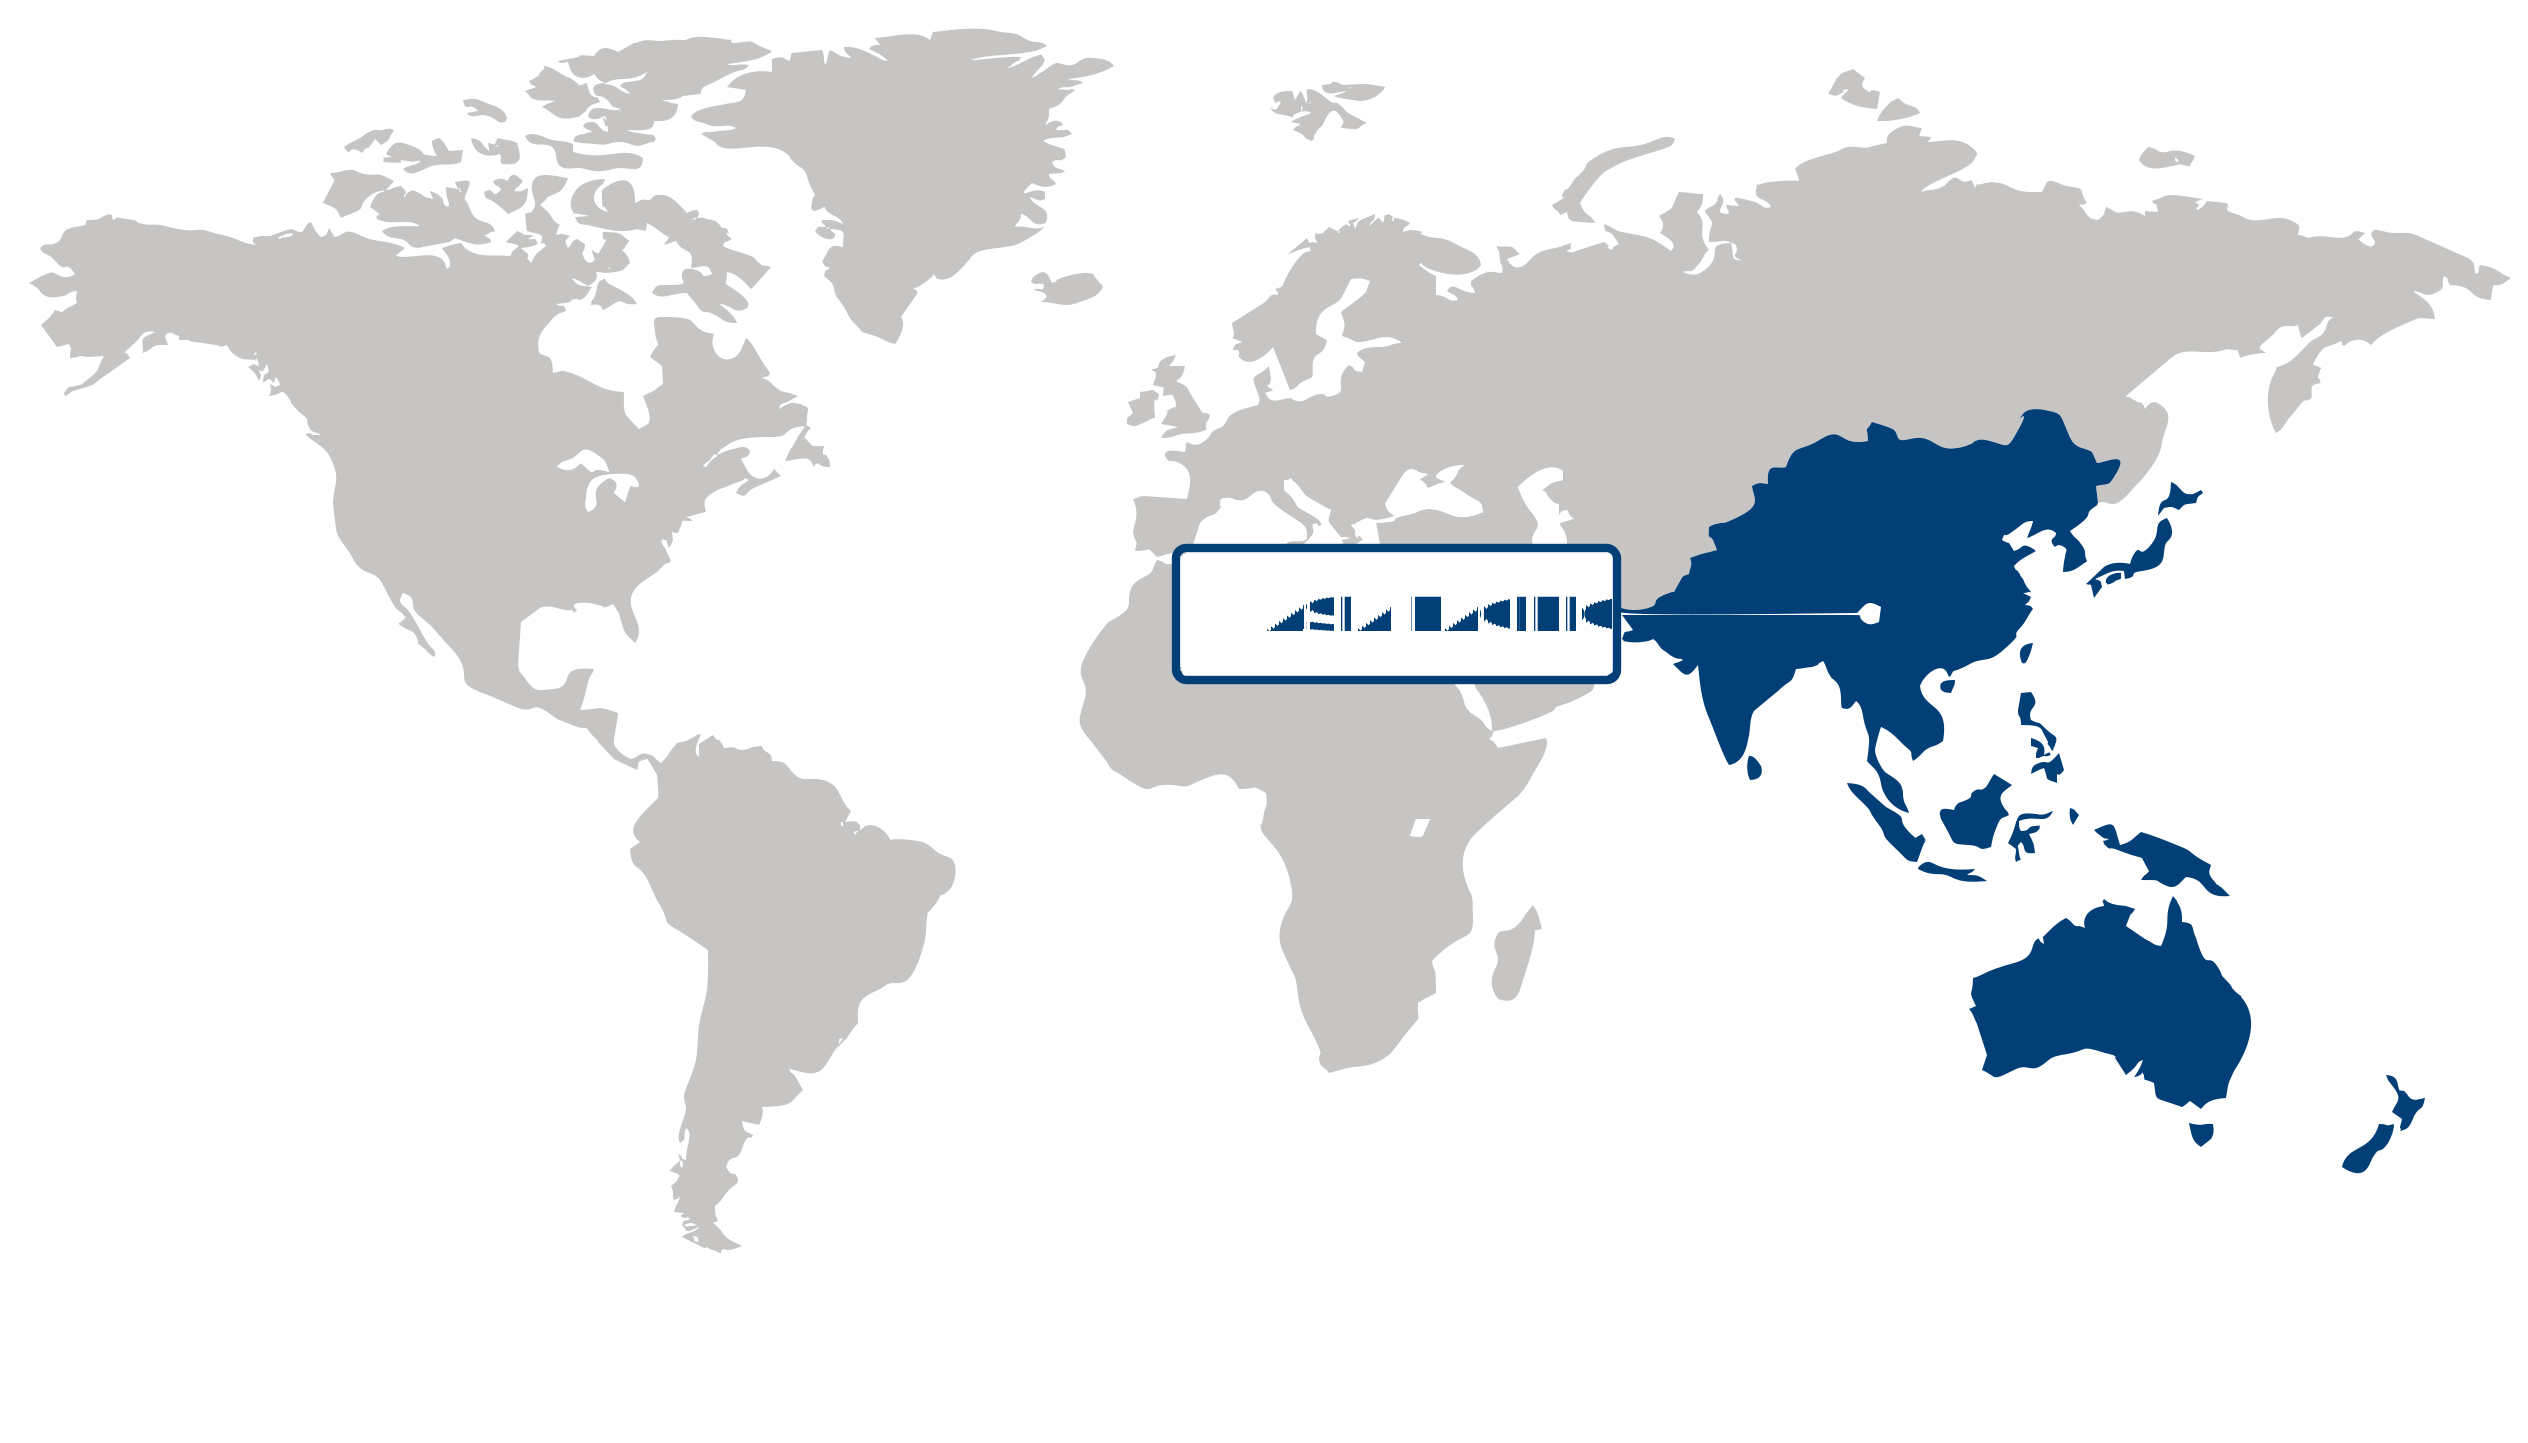
Asia Pacific (Largest & Fastest-Growing Region)
Asia Pacific led the intercity buses market with a 61.08% share in 2026 and is also expected to remain the fastest-growing region, supported by extensive intercity transportation networks, rapid urbanization, and strong demand for affordable mobility between major cities and surrounding communities. Dense population centers and expanding economic activity are increasing passenger movement across urban and regional corridors, while investments in road infrastructure are improving connectivity. Growing tourism, expanding employment opportunities across cities, and the need for cost-effective long-distance transportation are further sustaining demand for intercity bus services. At the same time, fleet modernization and increasing adoption of cleaner and more technologically advanced buses are creating opportunities for operators to improve service quality and operational efficiency.
| Parameter | Nordamerika | Asien-Pazifik | Europa | Lateinamerika | Nahost und Afrika |
|---|---|---|---|---|---|
| Innovationszentrum i Skala Entstehend Entwickelt sich Fortgeschritten | |||||
| Kostensensibilität der Region i Skala Niedrig Mittel Hoch | |||||
| Regulatorisches Umfeld i Skala Restriktiv Neutral Unterstützend | |||||
| Nachfragetreiber i Skala Schwach Moderat Stark | |||||
| Entwicklungsstand i Skala Aufstrebend Entwickelt sich Entwickelt | |||||
| Adoptionsrate i Skala Niedrig Mittel Hoch | |||||
| Neue Marktteilnehmer / Start-ups i Skala Gering Moderat Hoch | |||||
| Makroökonomische Indikatoren i Skala Schwach Stabil Stark |
Segment Leadership and Growth Trends
Go beyond the chart, access full insights & data tables
Kostenlosen Musterbericht anfordernBus Type Segment Analysis: Motor Coach (Largest Segment) vs Minibus (Fastest-Growing Segment)
The motor coach segment held the largest share of 66.24% in the intercity buses market in 2026. Motor coaches are widely preferred for long-distance travel due to their superior passenger comfort, larger luggage capacity, and ability to accommodate high passenger volumes efficiently. Their extensive deployment across scheduled intercity routes and premium transportation services has contributed significantly to segment dominance. Growing demand for comfortable and reliable long-distance transportation continues to support the strong position of motor coaches within the market.
The minibus segment is emerging as the fastest-growing bus type category due to increasing demand for flexible and cost-effective transportation solutions. Minibuses are particularly well suited for routes with moderate passenger volumes and for serving areas where large vehicles may be less practical. Rising focus on regional connectivity and efficient passenger transport services is driving greater adoption of minibuses across various intercity travel applications.
Application Segment Analysis: Intercity Transport (Largest Segment) vs Tour & Travel (Fastest-Growing Segment)
The intercity transport segment accounted for a 43.2% share in 2026, making it the largest application area within the intercity buses market. Demand is primarily driven by the essential role of buses in connecting cities and providing affordable mobility options for commuters and travelers. Expanding transportation networks and growing passenger preference for economical travel solutions continue to support the segment’s leadership position.
The tour & travel segment is witnessing the fastest growth as tourism activities expand and travelers increasingly seek organized group transportation options. Intercity buses provide convenient and cost-effective mobility for sightseeing, leisure travel, and destination-based tours. The recovery and expansion of tourism-related activities, coupled with rising interest in experiential travel, are contributing significantly to the growth of this application segment.
Seating Capacity Segment Analysis: Large Buses (36 Seats and Above) (Largest Segment) vs Up to 30 Passengers (Fastest-Growing Segment)
The large buses with 36 seats and above segment held the largest share in 2026, supported by their ability to transport substantial passenger volumes efficiently across long-distance routes. These vehicles are widely utilized by commercial operators seeking to maximize capacity utilization while meeting growing demand for intercity transportation services. Their suitability for high-traffic routes and organized travel operations has reinforced their dominant market position.
In the intercity buses market, the up to 30 passengers seating capacity segment is projected to grow at the fastest pace. Smaller-capacity buses offer greater operational flexibility and are increasingly deployed on routes with lower passenger density or specialized transportation requirements. Their ability to serve niche travel segments and improve route optimization is encouraging wider adoption, supporting strong growth prospects for this category.
| Segment | Untersegment | Größtes Segment | Am schnellsten wachsend |
|---|---|---|---|
| Bustyp | Reisebus, Linienbus, Minibus | ||
| Sitzplatzkapazität | Bis zu 30 Fahrgäste, Kleinbusse (9-25 Sitzplätze), Mittelgroße Busse (26-35 Sitzplätze), Große Busse (36 Sitzplätze und mehr) | ||
| Kraftstoffart | Diesel, Erdgas, Hybrid-Elektro, Batterie-Elektro | ||
| Anwendung | Fernverkehr, Flughafentransfer, Reiseveranstalter, Firmen-Shuttle, Sonstiges |
Wettbewerbslandschaft und Marktpositionierung
Leading companies in the intercity buses market:
- Yutong Bus Co., Ltd. (China)
- Volvo Buses (Sweden)
- Daimler Buses (Germany)
- Scania AB (Sweden)
- Ashok Leyland Limited (India)
- Tata Motors Limited (India)
- Irizar Group (Spain)
- Van Hool NV (Belgium)
- Marcopolo S.A. (Brazil)
- King Long United Automotive Industry Co., Ltd. (China)
The intercity buses market is evolving as operators compete through service quality, fleet modernization, and passenger-centric mobility solutions. Traditional cost-based competition is gradually giving way to differentiation through improved travel experiences, operational efficiency, and integration with broader transportation networks. Providers that can adapt to changing commuter expectations by offering reliable schedules, enhanced onboard features, and more sustainable mobility options are gaining stronger positioning. Regional operators continue to reinforce their presence by focusing on route specialization and localized demand patterns.
| Unternehmen | Marktanteil | Unternehmensumsatz | Umsatz-CAGR (%) | Produktportfolio | Geografische Präsenz | Innovations- / F&E-Schwerpunkt | Strategische Entwicklungen |
|---|---|---|---|---|---|---|---|
| Yutong Bus Co. Ltd. (China) | |||||||
| Volvo Buses (Sweden) | |||||||
| Daimler Buses (Germany) | |||||||
| Scania AB (Sweden) | |||||||
| Ashok Leyland Limited (India) | |||||||
| Tata Motors Limited (India) | |||||||
| Irizar Group (Spain) | |||||||
| Van Hool NV (Belgium) | |||||||
| Marcopolo S.A. (Brazil) | |||||||
| King Long United Automotive Industry Co. Ltd. (China) |
Branchenentwicklung/Nachrichten
| Unternehmensname | Datum | Wichtige Entwicklung |
|---|
Diesen Bericht erkunden
Klicken Sie auf einen Bereich des Rades oder die nummerierte Markierung, um individuelle Segmentierungen, ein individuelles Inhaltsverzeichnis oder verwandte Berichte anzuzeigen.
Markt für Fernbusse — Custom Segments
| Segment | Untersegment |
|---|---|
| Keine Segmentdaten verfügbar. | |
Markt für Fernbusse — report.custom
| Individuelles Kapitel | Individuelle Details | ||
|---|---|---|---|
| Keine Daten zum individuellen Inhaltsverzeichnis verfügbar. | |||
Benötigen Sie eine andere Datenauswertung?
Individuelle Recherche anfordernWie hoch sind die aktuellen Umsätze des Marktes für Überlandbusse?
Wie sehen die Wachstumsprognosen für die Fernbusbranche aus?
Wie beeinflussen Infrastrukturinvestitionen das Wachstum im Markt für Überlandbusse?
Warum werden digitale Ticketing-Plattformen für Fernbusunternehmen immer wichtiger?
Warum ist das Segment der Reisebusse führend auf dem Markt für Überlandbusse?
Warum ist die Reise- und Touren-App das am schnellsten wachsende Segment im Markt für Überlandbusse?
Warum ist der asiatisch-pazifische Raum führend auf dem Markt für Überlandbusse?
Was treibt das anhaltende Wachstum des Fernbusverkehrs im asiatisch-pazifischen Raum an?
Welche Unternehmen treiben das Wachstum im Bereich der Fernbusse voran?
Unsere Kunden
"The reports offered a comprehensive view of the Food and Beverage landscape, covering market trends, consumer behavior, and competitive dynamics."
"Our experience in acquiring market research reports has been outstanding — the depth of analysis and actionable insights have proven invaluable."
"Fundamental Business Insights demonstrated a keen understanding of our business needs, delivering reports tailored to our specific objectives."
Unser Forschungsteam & unsere Methodik
Every Fundamental Business Insights report is built by a dedicated vertical research team, validated through a structured primary-and-secondary methodology, and reviewed for accuracy before it reaches you.
Delivery
Published
Demand
Available
Support
Trust & Compliance
Research Intelligence
| Quellenkategorie | Forschungsquellen | Zweck |
|---|---|---|
| Government Publications | Government agencies, statistical departments, regulatory bodies | Industry statistics, regulatory insights, and policy analysis |
| Company Disclosures | Annual reports, investor presentations, financial filings | Company performance, business strategy, and market positioning |
| Trade Associations | Industry associations and professional organizations | Industry developments, standards, and market perspectives |
| Technical Literature | Research papers, technical publications, academic journals | Technology developments and technical validation |
| Patent Analysis | Patent databases and intellectual property publications | Innovation trends, technology activity, and competitive research |
| Industry Databases | Established research databases and market intelligence resources | Market benchmarking, historical data, and industry analysis |
Forschungsworkflow & Qualitätssicherung
Datenerhebung
Verified information gathered through primary and secondary research.
Datentriangulation
Cross-validation using multiple independent data sources.
Prognosemodellierung
Market estimates developed using historical trends and analytical models.
Analystenvalidierung
Findings reviewed by domain experts for accuracy and consistency.
Redaktionelle & Qualitätsprüfung
Final editorial, quality, and compliance checks before publication.
Endgültige Veröffentlichung
Released after successful completion of the internal review process.
Berichtsabdeckung
📊 Marktbewertung
- Market Size & Forecast
- Market Segmentation
- Regional Analysis
- Growth Drivers & Challenges
- Marktdynamik
🏢 Wettbewerbsanalyse
- Wettbewerbslandschaft
- Company Profiles
- Competitive Benchmarking
- Mergers & Acquisitions
- Market Share Analysis or Key Company Strategies
🔍 Strategische Analyse
- Value Chain Analysis
- Porter's Five Forces
- PESTLE Analysis
- Pricing Trends
- Supply-Demand Analysis
🚀 Zukunftsausblick
- Technology Landscape
- Regulatory Landscape
- Investment & Funding Landscape
- Emerging Opportunities
- Future Market Outlook
Have a question about this report or need a custom scope?
Anpassung anfordern