Capacitor Bank Market Size & Growth Forecast 2026–2035, By Segments (Voltage, Application), Regional Demand Trends (North America, Asia Pacific, Europe), Key Country Insights (U.S., Japan, South Korea, Germany, France, Italy), and Competitive Landscape
Market Size and Growoth Outlook
Capacitor Bank Market size was worth USD 5.02 Billion in 2025 and is expected to grow at a 5% CAGR between 2026 and 2035, exceeding USD 8.18 Billion by 2035. The industry revenue for 2026 is assessed at USD 5.23 billion.
Get more details on this report
Request Free Sample ReportCapacitor Bank Market Intelligence Snapshot
Regional Market Dynamics
- Asia Pacific leads the market due to extensive power networks, ongoing grid expansion, and strong industrial electricity demand that supports continuous capacitor bank deployment.
- North America is expected to grow at a 5.7% CAGR, supported by grid modernization, power quality improvement initiatives, and upgrades to aging electrical infrastructure.
Segment Momentum
- Power factor correction accounted for 32.27% of the market in 2025 because it delivers direct operational benefits by improving system efficiency, reducing reactive power burden, and minimizing electrical losses.
- Renewable integration is growing rapidly as power systems incorporate more variable renewable generation. Capacitor banks help stabilize voltage and manage reactive power fluctuations in renewable-connected networks.
Market Expansion Drivers
- Renewable energy grid integration increasing demand for voltage stabilization systems.
- Rising electricity consumption from industrialization and electronic device penetration.
- Smart grid modernization expanding reactive power compensation infrastructure deployment.
Leading Market Participants
Global Market Forecast Snapshot
Market Outlook
Key companies in the capacitor bank market include ABB Ltd. (Switzerland), Siemens AG (Germany), Schneider Electric SE (France), Eaton Corporation plc (Ireland), General Electric Company (United States), Hitachi, Ltd. (Japan), Toshiba Corporation (Japan), Larsen & Toubro Limited (India), Bharat Heavy Electricals Limited (India), Comar Condensatori S.p.A. (Italy).Regional and Segment Outlook
Asia PacificMarket Growth Drivers and Industry Trends
As solar and wind capacity adds more intermittent generation to transmission and distribution networks, utilities are under greater pressure to manage voltage fluctuations and maintain power quality in real time. This is directly driving demand for the capacitor bank market because capacitor banks provide a relatively fast, established, and cost-effective way to support reactive power compensation and voltage stabilization at substations, feeder lines, and renewable interconnection points. In practice, grid operators deploying higher shares of renewables are reinforcing network sections that experience variable output, and that procurement pattern is aiding market expansion for capacitor bank systems designed to improve grid stability without requiring large-scale redesign of existing infrastructure.
Rising electricity consumption from industrialization and electronic device penetration
Expanding industrial activity and the growing use of electronic equipment are increasing load intensity and placing more stress on power distribution systems, especially where motors, drives, HVAC systems, data-processing equipment, and automated production lines create persistent reactive power demand. This is influencing market adoption in the capacitor bank market because industrial facilities and commercial power users install capacitor banks to improve power factor, reduce losses, and avoid utility penalties tied to inefficient electricity usage. As utilities and end users respond to heavier and more complex consumption profiles, purchasing decisions increasingly favor power quality equipment that can stabilize supply conditions while improving operating efficiency, reinforcing market demand for capacitor bank installations.
Smart grid modernization expanding reactive power compensation infrastructure deployment
Utility investment in grid automation, digital monitoring, and intelligent distribution management is changing how reactive power assets are planned and operated, creating a stronger deployment case for capacitor banks that can be integrated into modern control architectures. In the capacitor bank market, This trend is supporting market development by moving procurement beyond basic fixed installations toward switched and automated capacitor bank systems that respond to load variation, feeder conditions, and network efficiency targets. As smart grid programs emphasize measurable improvements in voltage control, loss reduction, and asset utilization, capacitor banks become a practical infrastructure component in modernization roadmaps rather than a purely maintenance-driven purchase.
| Growth Driver | Impact on CAGR | Regulatory Influence | Geographic Relevance | Adoption Rate | Impact Timeline |
|---|---|---|---|---|---|
| Renewable energy grid integration increasing demand for voltage stabilization systems | 2.00% | High | Asia Pacific, Europe | High | Near Term |
| Rising electricity consumption from industrialization and electronic device penetration | 1.70% | Moderate | Asia Pacific, North America | High | Mid Term |
| Smart grid modernization expanding reactive power compensation infrastructure deployment | 1.50% | High | North America, Europe | Medium | Mid Term |
Unlock insights tailored to your business with our bespoke market research solutions.
Click to get your customized report now.
Regional Demand Dynamics
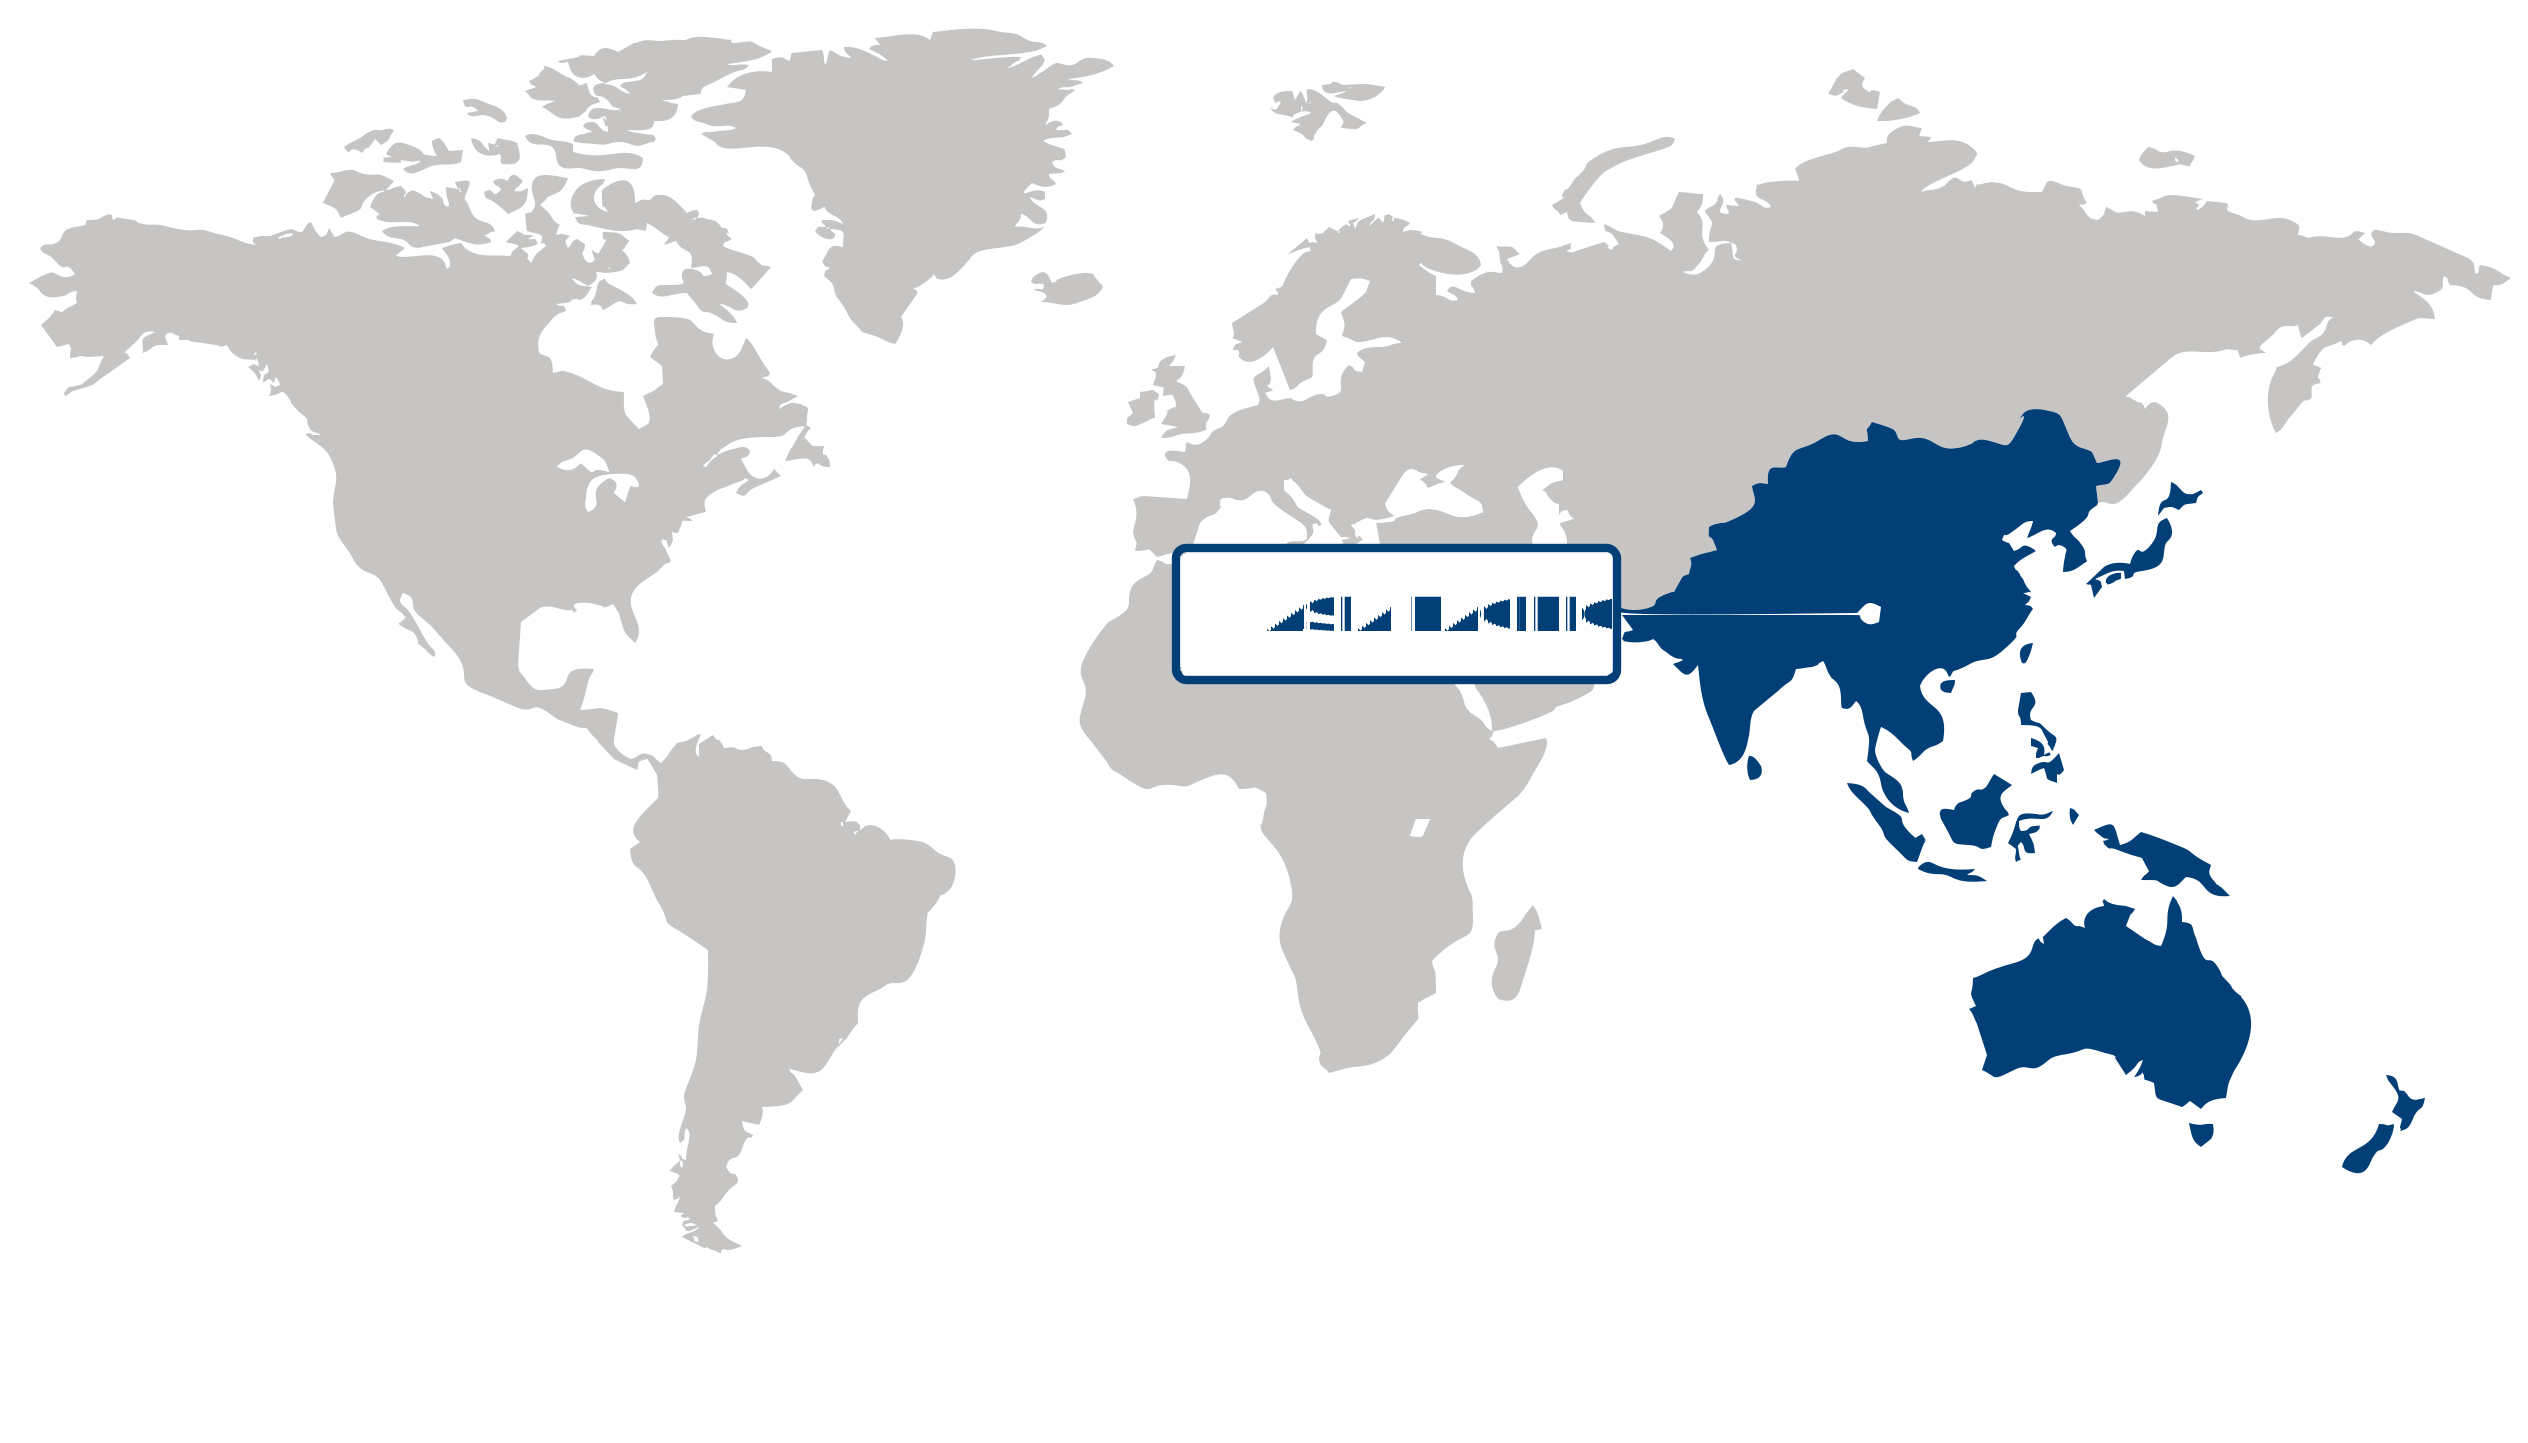
Asia Pacific held the largest regional share of the capacitor bank market in 2025, bolstered by the scale of power transmission and distribution networks, ongoing grid expansion, and the heavy presence of energy-intensive industrial activity. Utilities and industrial facilities across the region use capacitor banks to improve power factor, reduce transmission losses, and stabilize voltage in systems facing rising electricity demand, which keeps procurement tied closely to practical network performance needs. This operating environment sustains the region’s leading position as investments continue across substations, manufacturing sites, and expanding urban electricity infrastructure.
North America is projected to grow at a 5.7% CAGR over the forecast period, with momentum in the capacitor bank market being driven by grid modernization and the need to improve power quality across aging electrical infrastructure. Utilities and commercial and industrial users are increasingly deploying capacitor banks to manage reactive power more efficiently, support voltage regulation, and improve system reliability as networks integrate more variable loads and distributed energy resources. Growth is also strengthened by replacement demand, as installed electrical systems are upgraded to meet current performance and efficiency requirements.
| Parameter | North America | Asia Pacific | Europe | Latin America | MEA |
|---|---|---|---|---|---|
| Innovation Hub i Scale Nascent Developing Advanced | |||||
| Cost-Sensitive Region i Scale Low Medium High | |||||
| Regulatory Environment i Scale Restrictive Neutral Supportive | |||||
| Demand Drivers i Scale Weak Moderate Strong | |||||
| Development Stage i Scale Emerging Developing Developed | |||||
| Adoption Rate i Scale Low Medium High | |||||
| New Entrants / Startups i Scale Sparse Moderate Dense | |||||
| Macro Indicators i Scale Weak Stable Strong |
Key Country Insights
Germany 🇩🇪
Industrial Power OptimizationGermany prioritizes capacitor bank installations that improve energy efficiency in manufacturing and industrial operations. Demand is shaped by the need to reduce power losses, stabilize electrical networks, and support increasingly automated production environments.
France 🇫🇷
Renewable Grid SupportFrance deploys capacitor banks to maintain power quality as renewable energy installations expand across the electricity network. Utilities prioritize equipment that enhances voltage stability while supporting efficient transmission and distribution infrastructure.
Italy 🇮🇹
Distribution Network UpgradeItaly focuses on capacitor bank deployment to improve electrical distribution efficiency and reduce system losses. Utilities and industrial operators increasingly modernize aging infrastructure with flexible reactive power compensation solutions.
Japan 🇯🇵
Reliable Network PerformanceJapan emphasizes capacitor bank solutions that strengthen power system reliability in densely connected electrical networks. Utilities and industrial users focus on efficient voltage control and stable operation for advanced manufacturing facilities.
South Korea 🇰🇷
Smart Grid IntegrationSouth Korea incorporates capacitor banks into smart grid development and modern industrial power systems. Buyers increasingly value intelligent monitoring capabilities that improve reactive power management and support efficient electricity distribution.
United States 🇺🇸
Grid Efficiency FocusThe U.S. capacitor bank market supports voltage regulation and power quality improvements across utilities and industrial facilities. Investments increasingly emphasize grid modernization, renewable energy integration, and reliable reactive power compensation solutions.
Segment Leadership and Growth Trends
Capacitor Bank Market Share (%), Voltage, 2025
Go beyond the chart, access full insights & data tables
Request Free Sample ReportBy 2025, Medium Voltage [10 kV - 69 kV] held a 51.05% share of the capacitor bank market, reflecting its broad use across distribution networks, industrial facilities, and commercial power systems where reactive power compensation is routinely required. its position is underpinned by the practical fit of medium voltage capacitor banks in everyday grid and facility operations, where utilities and end users need dependable power factor management, voltage support, and system efficiency improvements without the complexity associated with higher voltage installations.
High Voltage [>69 kV] is the fastest-growing segment in the capacitor bank market as grid operators and large-scale power infrastructure projects place greater emphasis on transmission-level voltage stability and reactive power control. Growth is being driven by the increasing need to manage power quality over longer distances and under more variable load conditions, making high voltage capacitor banks more relevant than lower-voltage alternatives in applications where network strength, bulk power transfer, and grid balancing requirements are becoming more demanding.
Application Segment Analysis: Power Factor Correction (Largest Segment) vs Renewable Integration (Fastest-Growing Segment)
In the capacitor bank market, Power Factor Correction accounted for a 32.27% share in 2025, making it the leading application due to its direct operational value across industrial, commercial, and utility environments. The segment remains dominant because capacitor banks used for power factor correction address a routine and measurable requirement: reducing reactive power burden, improving system efficiency, and helping operators avoid unnecessary electrical losses and penalties tied to poor power factor performance.
Renewable Integration is the fastest-growing application in the capacitor bank market as power systems absorb a greater share of variable generation from renewable sources. Its momentum comes from the practical requirement to stabilize voltage and manage reactive power fluctuations introduced by intermittent generation, which makes capacitor banks increasingly important in renewable-connected networks compared with more conventional application areas where deployment patterns are already relatively established.
| Segment | Sub-Segment | Largest Segment | Fastest Growing |
|---|---|---|---|
| Voltage | Low [10 kV], Medium [10 kV - 69 kV], High [>69 kV] | Medium [10 kV - 69 kV] | High [>69 kV] |
| Application | Power Factor Correction, Harmonic Filter, Voltage Regulation, Renewable Integration, Industrial Application, Data Centers, Others | Power Factor Correction | Renewable Integration |
Competitive Landscape and Market Positioning
1. ABB Ltd. (Switzerland)
2. Siemens AG (Germany)
3. Schneider Electric SE (France)
4. Eaton Corporation plc (Ireland)
5. General Electric Company (United States)
6. Hitachi Ltd. (Japan)
7. Toshiba Corporation (Japan)
8. Larsen & Toubro Limited (India)
9. Bharat Heavy Electricals Limited (India)
10. Comar Condensatori S.p.A. (Italy)
Structural consolidation is fundamentally altering the capacitor bank market, as high-level buyouts allow entities to combine technical expertise and scale resources rapidly. Rather than relying solely on organic growth, top-tier power infrastructure providers are using consolidated portfolios to aggressively expand their geographic reach. This wave of consolidation is simultaneously accelerating grid stability advancements, creating a highly competitive climate where utility providers demand turnkey, energy-efficient power factor correction systems.
| Company | Market Share | Company Revenue | Revenue CAGR (%) | Product Portfolio | Geographic Presence | Innovation / R&D Focus | Strategic Developments |
|---|---|---|---|---|---|---|---|
| No companies available. | |||||||
Industry Development/News
| Company Name | Date | Key Development |
|---|---|---|
| Hitachi Energy | Aug-22 | Hitachi Energy inaugurated a new power quality products manufacturing plant in Doddaballapur, Bengaluru. The facility significantly expands the company's production capacity for advanced capacitor units and power electronic compensators, directly addressing growing market demand for grid stability and energy loss reduction infrastructure. |
| Powerside | Feb-24 | Powerside launched Pole-MVar, a compact, pole-mounted tuned-filter capacitor bank designed to mitigate harmonic distortion and resonance. The material product innovation combines reactive energy compensation with inductors, offering utilities and commercial operations a scalable solution to handle non-linear loads driven by modern grid integrations. |
| Manila Electric Company (Meralco) | Aug-24 | Meralco completed a ₱201.34 million expansion of its Eton Centris Gas Insulated Switchgear Substation in Quezon City. The infrastructure project deployed a new 83 MVA power transformer, 34.5 kV GIS equipment, four additional feeders, and a 14.4 MVAR capacitor bank to handle rising regional electricity demands. |
Explore This Report
Click a section of the wheel — or its numbered marker — to preview the custom segmentation, custom table of contents, or related reports available for this market.
Capacitor Bank Market — Custom Segments
| Segment | Sub-Segment |
|---|---|
| No segment data available. | |
Capacitor Bank Market — report.custom
| Custom Chapter | Custom Details | ||
|---|---|---|---|
| No custom TOC data available. | |||
Need a different cut of the data?
Request Custom ResearchHow much revenue does the capacitor bank market generate?
How much is the capacitor bank industry expected to grow by 2035?
How is renewable energy integration shaping demand for capacitor bank deployments?
Why are automated capacitor bank systems gaining strategic importance in grid modernization programs?
Why is power factor correction the leading application in the capacitor bank market?
Why is renewable integration the fastest-growing application segment in the capacitor bank market?
Why is Asia Pacific the largest market for capacitor banks?
How is North America creating growth opportunities in the capacitor bank market?
What are the prominent companies operating in the capacitor bank landscape?
Our Clients
"The reports offered a comprehensive view of the Food and Beverage landscape, covering market trends, consumer behavior, and competitive dynamics."
"Our experience in acquiring market research reports has been outstanding — the depth of analysis and actionable insights have proven invaluable."
"Fundamental Business Insights demonstrated a keen understanding of our business needs, delivering reports tailored to our specific objectives."
Our Research Team & Methodology
Every Fundamental Business Insights report is built by a dedicated vertical research team, validated through a structured primary-and-secondary methodology, and reviewed for accuracy before it reaches you.
Research Team Overview
Prepared by the Energy & Power Research Team
Delivery
Published
Demand
Available
Support
Trust & Compliance
Research Domains
10 coverage areasResearch Intelligence
| Source Category | Research Sources | Purpose |
|---|---|---|
| Government Publications | Government agencies, statistical departments, regulatory bodies | Industry statistics, regulatory insights, and policy analysis |
| Company Disclosures | Annual reports, investor presentations, financial filings | Company performance, business strategy, and market positioning |
| Trade Associations | Industry associations and professional organizations | Industry developments, standards, and market perspectives |
| Technical Literature | Research papers, technical publications, academic journals | Technology developments and technical validation |
| Patent Analysis | Patent databases and intellectual property publications | Innovation trends, technology activity, and competitive research |
| Industry Databases | Established research databases and market intelligence resources | Market benchmarking, historical data, and industry analysis |
Research Workflow & Quality Assurance
Data Collection
Verified information gathered through primary and secondary research.
Data Triangulation
Cross-validation using multiple independent data sources.
Forecast Modelling
Market estimates developed using historical trends and analytical models.
Analyst Validation
Findings reviewed by domain experts for accuracy and consistency.
Editorial & Quality Review
Final editorial, quality, and compliance checks before publication.
Final Publication
Released after successful completion of the internal review process.
Report Coverage
📊 Market Assessment
- Market Size & Forecast
- Market Segmentation
- Regional Analysis
- Growth Drivers & Challenges
- Market Dynamics
🏢 Competitive Intelligence
- Competitive Landscape
- Company Profiles
- Competitive Benchmarking
- Mergers & Acquisitions
- Market Share Analysis or Key Company Strategies
🔍 Strategic Analysis
- Value Chain Analysis
- Porter's Five Forces
- PESTLE Analysis
- Pricing Trends
- Supply-Demand Analysis
🚀 Future Outlook
- Technology Landscape
- Regulatory Landscape
- Investment & Funding Landscape
- Emerging Opportunities
- Future Market Outlook
Have a question about this report or need a custom scope?
Request Customization