Bio-Solvents Market Size & Forecasts 2026-2035, By Segments (Application, type), Growth Opportunities, Innovation Landscape, Regulatory Shifts, Strategic Regional Insights (U.S., Japan, China, South Korea, UK, Germany, France), and Competitive Dynamics (DuPont, BASF, Green Biologics, Corbion, Braskem)
Market Size and Growoth Outlook
Bio-Solvents Market size is set to grow from USD 4.86 billion in 2025 to USD 8.38 billion by 2035, reflecting a CAGR greater than 5.6% through 2026-2035. Industry revenues in 2026 are estimated at USD 5.1 billion.
Get more details on this report
Request Free Sample ReportBio-Solvents Market Intelligence Snapshot
Regional Market Dynamics
Segment Momentum
Market Expansion Drivers
Leading Market Participants
Global Market Forecast Snapshot
Market Outlook
Regional and Segment Outlook
Market Growth Drivers and Industry Trends
Expansion in industrial cleaning and chemical applications: Growth in institutional and heavy-duty cleaning is bringing bio-based solvent options into broader industrial supply chains, expanding the addressable opportunity within the bio-solvents market. Examples such as Ecolab’s sustainability-focused product lines and Evonik’s investments in bio-based specialty chemicals show buyer preference for safer, lower-VOC alternatives in food, hospitality and manufacturing. Large chemical producers can scale and integrate logistics to serve industrial customers, while specialty formulators and contract manufacturers can win share by validating performance in demanding use cases. With the European Chemicals Agency and other regulators tightening controls on hazardous solvents, substitution programs will increasingly favor bio-based solutions.
Innovation in specialty bio-solvents: Advances in fermentation, catalytic upgrading and formulation science are producing differentiated bio-derived solvents for high-value applications, reframing competition across the bio-solvents market. Companies such as Genomatica, Amyris and Corbion, together with funding mechanisms like the European Commission’s Bio-based Industries Joint Undertaking, illustrate active commercialization and technology de-risking. Established players can pursue partnerships, licensing and co‑development to accelerate portfolio renewal; startups can extract premium margins through IP and specialized applications. As more pilot-to-commercial announcements and joint ventures appear, product pipeline differentiation will shape supplier positioning and go-to-market strategies.
Industry Restraints:
Regulatory Compliance Burdens
Stringent, fragmented chemical regulation elevates time-to-market and capital intensity for bio-solvents: registration under the European Chemicals Agency (ECHA) REACH regime, U.S. Environmental Protection Agency (EPA) TSCA reviews, and California Air Resources Board (CARB) VOC and consumer product rules each impose separate testing, labeling, and reporting demands that slow product launches and raise development costs. ECHA’s REACH dossiers and EPA notifications have lengthened approval timelines in recent filings, and CARB’s rulemaking has required reformulation for solvent users. Established firms with regulatory teams can absorb delays; smaller innovators face dilution of IP value or must pursue expensive third-party certification. Expect continued stratification over the near term as regional regulatory tightening under the European Green Deal and continued EPA/CARB enforcement sustain compliance as a market-entry gatekeeper.
Feedstock Availability and Price Volatility
Dependence on agricultural and waste-derived feedstocks creates supply-side instability for bio-solvents: seasonal harvest swings, competing demand for food and biofuels, and logistics bottlenecks drive raw-material cost volatility documented by the U.S. Department of Agriculture (USDA) Economic Research Service and the Food and Agriculture Organization (FAO). Suppliers such as Neste have publicly noted rising competition for waste and residue streams, while commodity traders Archer Daniels Midland (ADM) and Cargill report crop-price sensitivity that cascades into downstream chemistry. Legacy chemical producers with integrated feedstock sourcing and long-term offtake contracts gain advantage; early-stage producers face margin compression and scaling risk. Near- to medium-term dynamics point to continued pressure on supply security and incentive for vertical integration and feedstock diversification.
| Growth Driver | Impact on CAGR | Regulatory Influence | Geographic Relevance | Adoption Rate | Impact Timeline |
|---|---|---|---|---|---|
| Rising demand for bio-based solvents in coatings & cleaning | 2.00% | Short term (≤ 2 yrs) | Europe, North America | Medium | Fast |
| Expansion in industrial cleaning and chemical applications | 1.80% | Medium term (2–5 yrs) | Asia Pacific, Europe | Medium | Moderate |
| Innovation in specialty bio-solvents | 1.80% | Long term (5+ yrs) | North America, Europe | High | Slow |
Unlock insights tailored to your business with our bespoke market research solutions.
Click to get your customized report now.
Regional Demand Dynamics
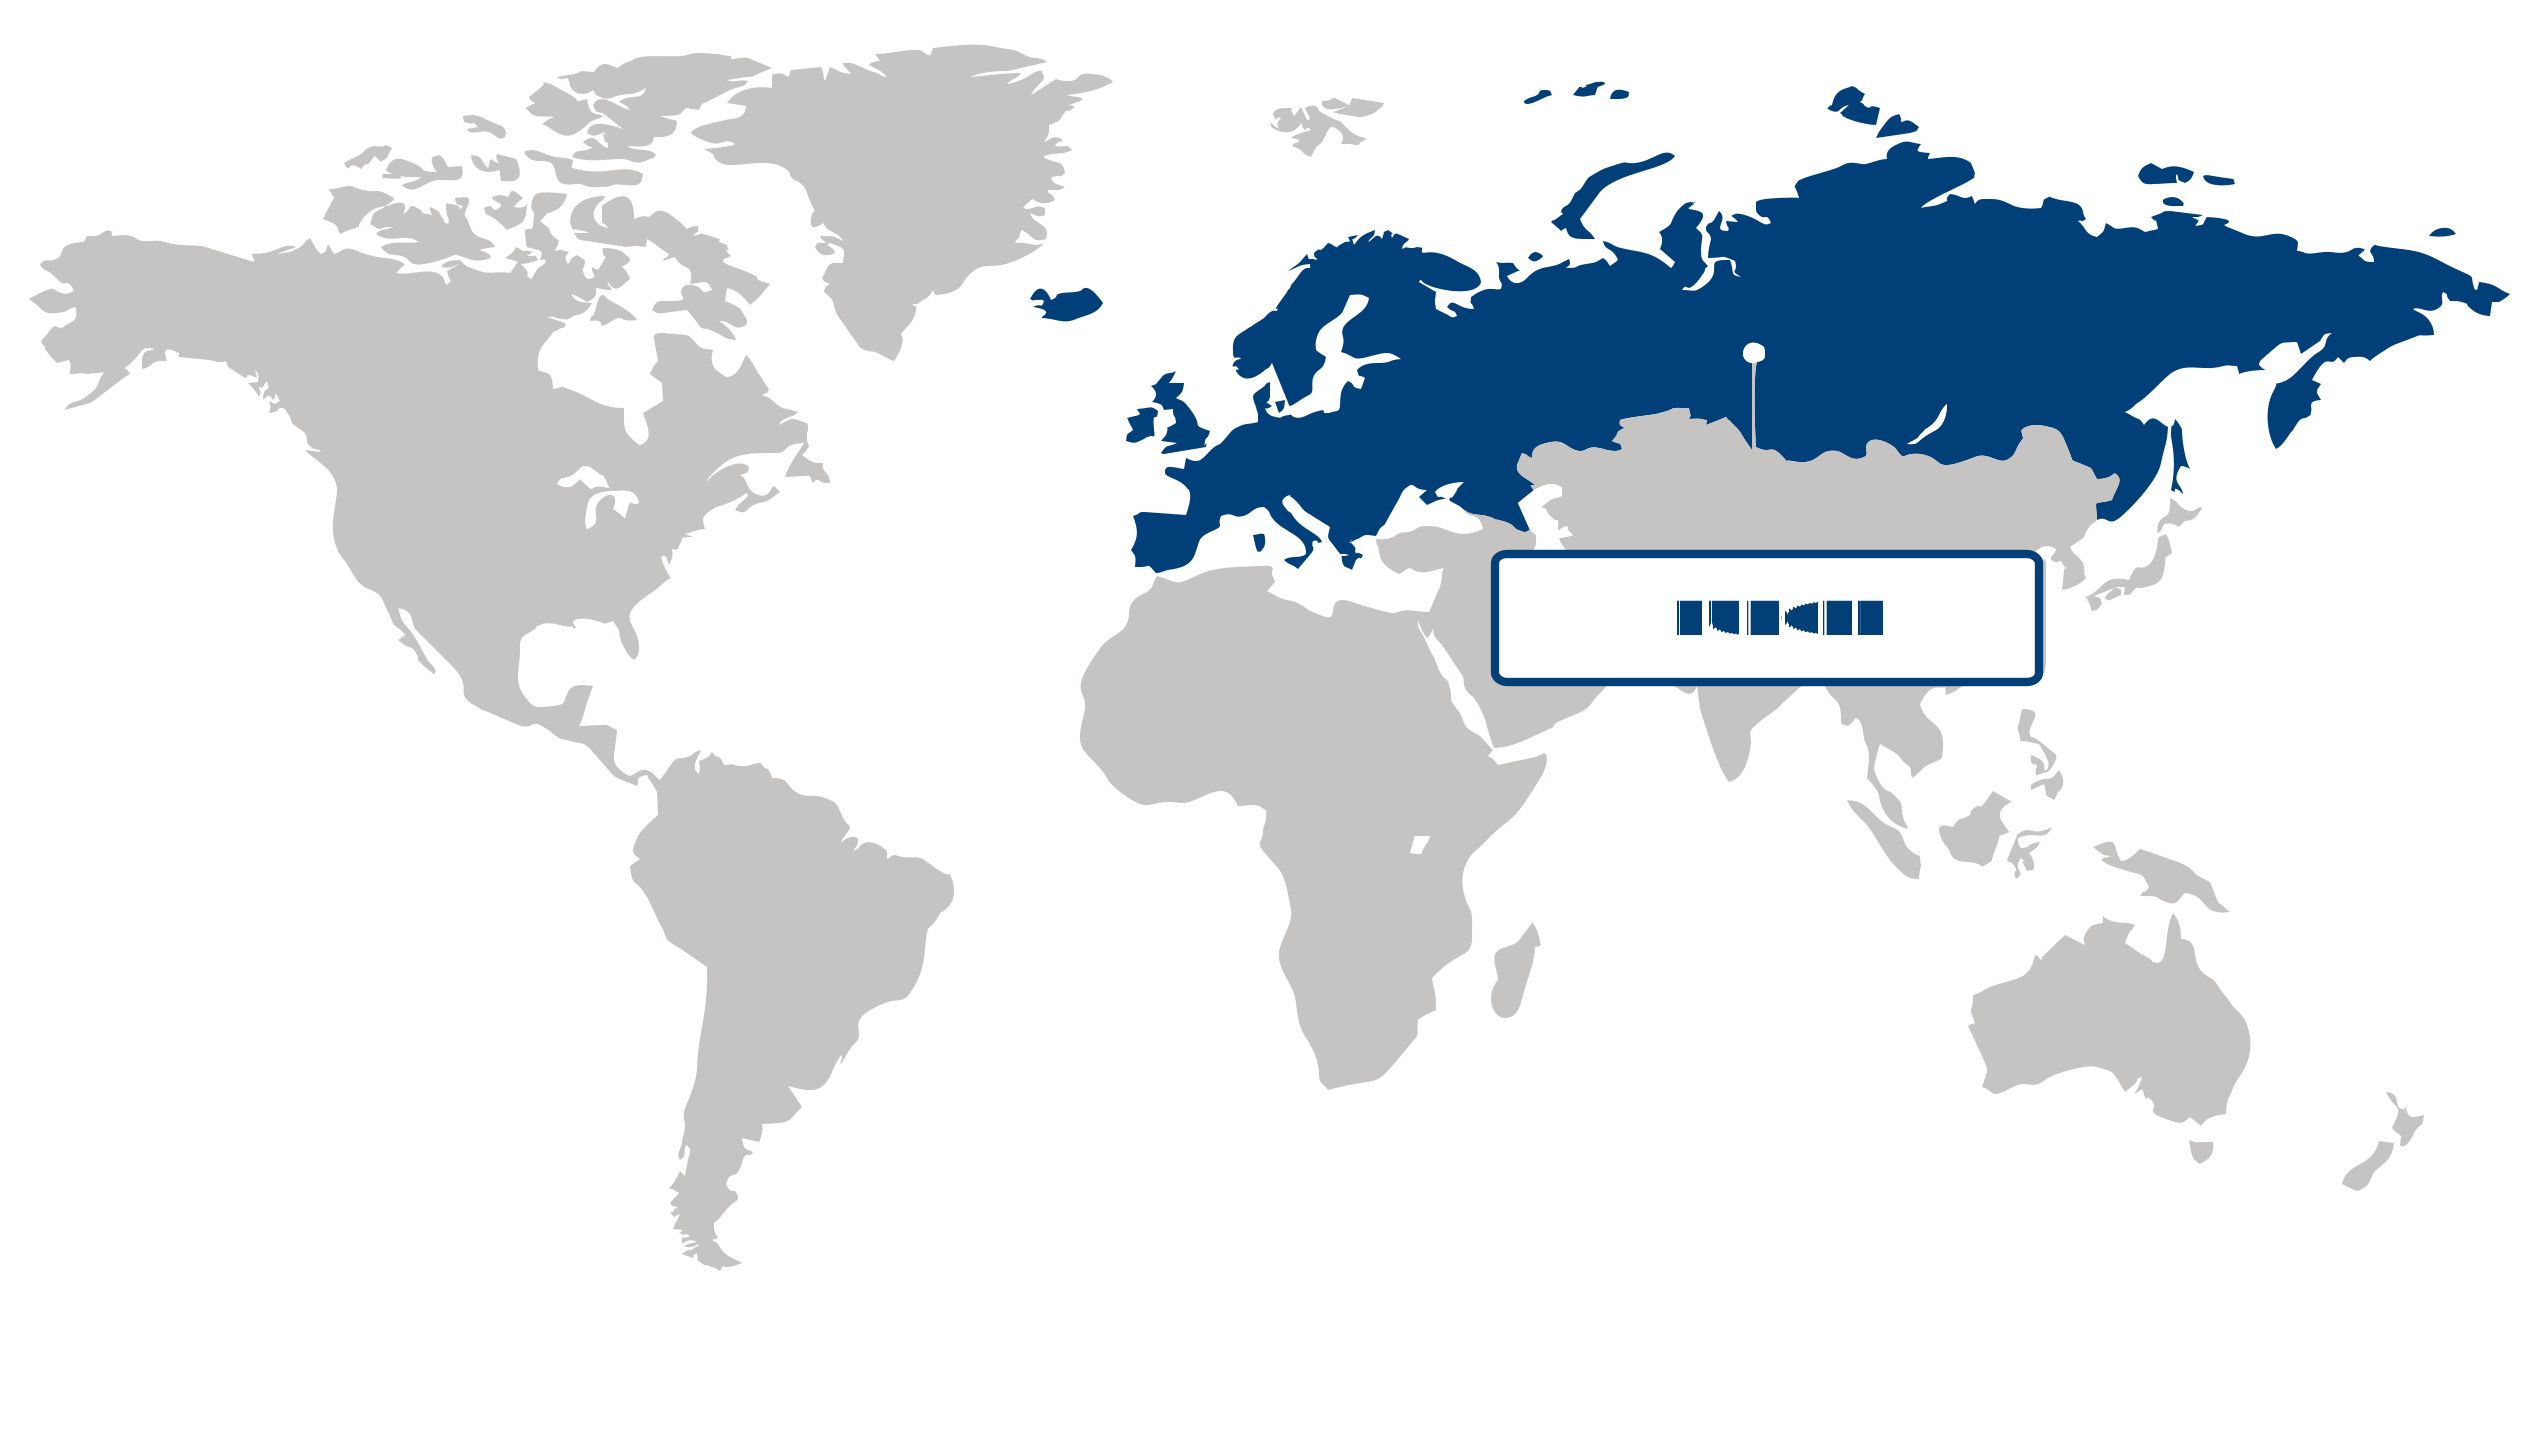
Europe captured approximately 36.00% of the global market in 2025, establishing itself as the largest regional player for the bio-solvents market driven by extensive chemical manufacturing and pharmaceutical activity across the bloc. This leadership is underpinned by the scale of the European chemical industry (CEFIC), a dense pharmaceutical footprint reflected in EFPIA membership and manufacturing sites, and regulatory and policy momentum from the European Commission’s Green Deal and ECHA’s REACH framework that favor lower-impact chemistries. Major producers such as BASF and Evonik have announced shifts toward bio-based product lines, and Eurostat data on industrial output supports investment resilience. These combined forces—policy alignment, industrial scale, and buyer demand for sustainable inputs—position Europe as a high-opportunity region for commercializing bio-solvents.
Germany anchors the regional landscape for the bio-solvents market, leveraging deep chemical clusters and a strong pharmaceutical manufacturing base that compresses R&D-to-scale timelines. Germany’s industry associations (VCI) and institutes such as Fraunhofer-Gesellschaft support pilot-to-commercial transitions, while companies like BASF and Evonik maintain integrated value chains that lower technical and logistical barriers. Germany’s vocational training systems and process engineering capabilities further reduce scale-up risk. For investors and strategic planners, Germany’s cluster density and industrial services ecosystem make it the natural staging ground for capacity builds that can serve the broader European market.
France positions itself as a pivotal hub for the bio-solvents market, supported by major pharmaceutical firms and targeted national bioeconomy programs that accelerate demand and commercialization. Sanofi’s manufacturing presence, ADEME’s sustainable-chemistry initiatives, and Bpifrance financing for industrial biotech create a favorable commercial and financing environment, while strong domestic demand from sectors such as cosmetics (e.g., L’Oréal) drives early procurement of bio-based solvents. France’s coordinated policy and financing approach reduces commercialization friction and complements Germany’s manufacturing depth, collectively reinforcing Europe’s leadership in bio-solvents.
Asia Pacific Market Analysis:
The Asia Pacific bio-solvents market registered rapid growth, posting a CAGR of 6.4% and emerging as the fastest-growing region; this expansion is driven by rising demand for bio-based solvents in industrial applications across APAC. Industrial end-users—from coatings and adhesives to pharmaceuticals and electronics cleaning—are sourcing bio-derived alternatives to meet corporate sustainability targets and tighter emissions rules, while large-scale manufacturers and distributors scale supply chains to meet volume needs. Japan’s Green Growth Strategy (Ministry of Economy, Trade and Industry) and China’s tighter VOC controls (Ministry of Ecology and Environment) have reinforced procurement shifts, and corporate moves such as Mitsubishi Chemical’s bio-based material initiatives and Sinopec’s sustainable chemicals investments exemplify commercial momentum. Given regulatory pressure, industrial scale, and active corporate R&D, APAC offers near-term adoption opportunities and mid-term value capture for differentiated bio-solvent technologies and supply-chain solutions.
Japan is a technology-led adopter in the Asia Pacific bio-solvents market, where high-performance applications and strict environmental standards accelerate uptake of specialty bio-solvents. Demand from electronics manufacturers, pharmaceutical formulators, and precision coatings suppliers is paired with strong R&D and pilot-scale deployment by firms such as Mitsubishi Chemical, and policy support referenced in METI’s Green Growth Strategy encourages commercialization of bio-based chemicals. Japan’s premium pricing tolerance, advanced formulation capabilities, and supplier partnerships enable targeted launches of high-margin, performance-differentiated bio-solvents. Strategically, Japan serves as a validation and premium-reference market that can de-risk product claims and support regional scale-up across APAC.
China is the scale driver of the Asia Pacific bio-solvents market, where large-volume industrial consumption and tightening environmental enforcement accelerate substitution toward bio-based options. Industrial policy and local enforcement by the Ministry of Ecology and Environment have increased demand for lower-VOC and biodegradable solvent solutions across coatings, printing, and industrial cleaning; meanwhile, Chinese refiners and chemical groups such as Sinopec are investing in bio-based feedstock routes and distribution capacity to capture volume. Cost-competitive production, extensive downstream manufacturing clusters, and rapidly digitalized procurement channels make China the primary conversion market for mid-priced bio-solvents. For regional investors and suppliers, winning in China offers the demand scale needed to optimize supply economics and fund broader APAC expansion.
North America Market Trends:
North America experienced moderate growth in the bio-solvents market, supported by a mix of public procurement preferences, research commercialization and tightening emissions rules that together raised demand for renewable, lower‑VOC alternatives. Evidence includes the U.S. Department of Agriculture’s BioPreferred Program steering federal purchases toward bio-based products, the U.S. Environmental Protection Agency’s (EPA) Safer Choice and VOC guidance encouraging safer solvent substitution, and Environment and Climate Change Canada’s policy signals on cleaner chemistries; National Renewable Energy Laboratory (NREL) work on bioprocess scale‑up and American Chemistry Council (ACC) analyses of chemical-industry resilience further illustrate implementation pathways. These combined signals, plus growing corporate sustainability targets, create a durable platform for near‑term product adoption and private investment across supply chains. North America’s large end‑markets and research‑to‑manufacturing pipeline therefore present significant opportunities for scale‑up and premium positioning.
The U.S. served as the primary commercialization hub in the bio-solvents market, leveraging its manufacturing scale, buyer concentration and technology transfer mechanisms to convert laboratory advances into commercial products. Large consumer‑goods procurement commitments—illustrated by Procter & Gamble’s public sustainability targets—and demand shifts in industrial coatings seen in Sherwin‑Williams’ low‑VOC product lines are driving formulators to source renewable solvent options; meanwhile, U.S. Department of Energy (DOE) programs and national pilot facilities accelerate scale‑up of fermentation and catalytic routes. This combination of deep domestic demand, established specialty chemical supply chains and public‑sector scale‑up support implies that U.S. developments will continue to shape regional supplier strategies and investment priorities.
| Parameter | North America | Asia Pacific | Europe | Latin America | MEA |
|---|---|---|---|---|---|
| Innovation Hub i Scale Nascent Developing Advanced | |||||
| Cost-Sensitive Region i Scale Low Medium High | |||||
| Regulatory Environment i Scale Restrictive Neutral Supportive | |||||
| Demand Drivers i Scale Weak Moderate Strong | |||||
| Development Stage i Scale Emerging Developing Developed | |||||
| Adoption Rate i Scale Low Medium High | |||||
| New Entrants / Startups i Scale Sparse Moderate Dense | |||||
| Macro Indicators i Scale Weak Stable Strong |
Segment Leadership and Growth Trends
Bio-Solvents Market Share (%), Application, 2025
Go beyond the chart, access full insights & data tables
Request Free Sample ReportPaints & Coatings dominated the bio-solvents market in 2025 as the largest segment by share. This segment leads because stricter environmental regulations promoting low‑VOC and bio‑based coating formulations have pushed formulators toward bio-solvents, a dynamic reinforced by California Air Resources Board (CARB) standards and the European Commission Green Deal; AkzoNobel and PPG Industries have publicly advanced low‑VOC product lines that integrate bio‑based solvents. Customer preference for sustainable finishes, supplier investments in renewable feedstocks, and coatings manufacturers’ reformulation capabilities underpin the segment’s strength. These segments create strategic opportunities for incumbents to retrofit portfolios and for entrants to specialize in high‑performance blends. Regulatory momentum and steady demand for low‑VOC coatings will keep this segment relevant in the near to medium term.
Analysis by Type
Alcohols represented largest share in the bio-solvents market in 2025 as the leading segment by share. The segment’s leadership is driven by the high compatibility of bio‑alcohols with industrial formulations and cleaning applications, supported by supply expansions from Cargill and Archer Daniels Midland Company and product development from Green Biologics. Ease of drop‑in substitution, formulators’ preference for effective low‑toxicity solvents, and validation via the U.S. EPA Safer Choice program have accelerated adoption. These segments offer scale and distribution advantages for established firms and niche differentiation opportunities for emerging players through specialty alcohol derivatives and co‑development partnerships. Because many formulations depend on alcohol chemistries and sustainability and regulatory pressures persist, alcohols are likely to remain strategically important in the near to medium term.
| Segment | Sub-Segment | Largest Segment | Fastest Growing |
|---|---|---|---|
| Application | Industrial & Domestic Cleaners, Paints & Coatings, Adhesives, Printing Inks & Other Applications | ||
| type | Alcohols, Glycols, Diols, Lactate Esters, D-Limonene, Methyl Soyate & Others |
Competitive Landscape and Market Positioning
The competitive environment is defined by active consolidation of capabilities and concentrated efforts to move lab-scale pathways into commercial streams. Larger incumbents have complemented petrochemical portfolios with renewable solvent lines while specialist firms have emphasized platform refinement and pilot validation to secure commercial offtake. Cross-sector engagements with downstream brand owners and feedstock suppliers, expanded demonstration capacity, and focused investments in process intensification have shifted competitive advantage toward organizations that can combine product performance with verifiable sustainability credentials and reliable supply chains.
Strategic / Actionable Recommendations for Regional Players
North America: Leverage proximity to large formulators and established logistics by deepening commercial linkages with end-use manufacturers and agricultural feedstock suppliers; prioritize scale-up of modular continuous processing and downstream qualification to convert pilot success into reliable supply for coatings and specialty cleaning segments.
Asia Pacific: Build pragmatic regional partnerships with commodity producers and consumer-goods companies to secure flexible feedstock streams and co-develop solvent grades tailored to packaging and personal-care formulations; adopt digital process controls and modular bioprocess units to accelerate local commercialization while managing capital intensity.
Europe: Differentiate through certified circular feedstocks and integration with compostable polymer value chains; collaborate with regional bio-refineries and waste-management networks to close feedstock loops, and invest in low-emission process pilots to meet stringent sustainability and regulatory expectations while targeting premium, high-margin niche applications.
| Company | Market Share | Company Revenue | Revenue CAGR (%) | Product Portfolio | Geographic Presence | Innovation / R&D Focus | Strategic Developments |
|---|---|---|---|---|---|---|---|
| No companies available. | |||||||
Industry Development/News
| Company Name | Date | Key Development |
|---|
Explore This Report
Click a section of the wheel — or its numbered marker — to preview the custom segmentation, custom table of contents, or related reports available for this market.
Bio-Solvents Market — Custom Segments
| Segment | Sub-Segment |
|---|---|
| No segment data available. | |
Bio-Solvents Market — report.custom
| Custom Chapter | Custom Details | ||
|---|---|---|---|
| No custom TOC data available. | |||
Need a different cut of the data?
Request Custom ResearchHow large is the bio-solvents market?
How is the bio-solvents industry projected to perform over the next decade?
Which global region commands the highest percentage of the bio-solvents market?
Which area is showing the greatest surge in bio-solvents sector?
Why does paints & coatings sub-segment dominate the application segment of bio-solvents sector?
How much is the alcohols segment expected to grow in the bio-solvents industry beyond 2025?
Who holds a significant market share in the bio-solvents landscape?
Our Clients
"The reports offered a comprehensive view of the Food and Beverage landscape, covering market trends, consumer behavior, and competitive dynamics."
"Our experience in acquiring market research reports has been outstanding — the depth of analysis and actionable insights have proven invaluable."
"Fundamental Business Insights demonstrated a keen understanding of our business needs, delivering reports tailored to our specific objectives."
Our Research Team & Methodology
Every Fundamental Business Insights report is built by a dedicated vertical research team, validated through a structured primary-and-secondary methodology, and reviewed for accuracy before it reaches you.
Research Team Overview
Prepared by the Chemicals & Materials Research Team
Delivery
Published
Demand
Available
Support
Trust & Compliance
Research Domains
10 coverage areasResearch Intelligence
| Source Category | Research Sources | Purpose |
|---|---|---|
| Government Publications | Government agencies, statistical departments, regulatory bodies | Industry statistics, regulatory insights, and policy analysis |
| Company Disclosures | Annual reports, investor presentations, financial filings | Company performance, business strategy, and market positioning |
| Trade Associations | Industry associations and professional organizations | Industry developments, standards, and market perspectives |
| Technical Literature | Research papers, technical publications, academic journals | Technology developments and technical validation |
| Patent Analysis | Patent databases and intellectual property publications | Innovation trends, technology activity, and competitive research |
| Industry Databases | Established research databases and market intelligence resources | Market benchmarking, historical data, and industry analysis |
Research Workflow & Quality Assurance
Data Collection
Verified information gathered through primary and secondary research.
Data Triangulation
Cross-validation using multiple independent data sources.
Forecast Modelling
Market estimates developed using historical trends and analytical models.
Analyst Validation
Findings reviewed by domain experts for accuracy and consistency.
Editorial & Quality Review
Final editorial, quality, and compliance checks before publication.
Final Publication
Released after successful completion of the internal review process.
Report Coverage
📊 Market Assessment
- Market Size & Forecast
- Market Segmentation
- Regional Analysis
- Growth Drivers & Challenges
- Market Dynamics
🏢 Competitive Intelligence
- Competitive Landscape
- Company Profiles
- Competitive Benchmarking
- Mergers & Acquisitions
- Market Share Analysis or Key Company Strategies
🔍 Strategic Analysis
- Value Chain Analysis
- Porter's Five Forces
- PESTLE Analysis
- Pricing Trends
- Supply-Demand Analysis
🚀 Future Outlook
- Technology Landscape
- Regulatory Landscape
- Investment & Funding Landscape
- Emerging Opportunities
- Future Market Outlook
Have a question about this report or need a custom scope?
Request Customization