Carbon Trading Market Size & Forecasts 2026-2035, By Segments (Carbon Credit Type, Carbon Market Type, Trading Platform, Application, Methodology), Growth Opportunities, Innovation Landscape, Regulatory Shifts, Strategic Regional Insights (U.S., Japan, China, South Korea, UK, Germany, France), and Competitive Dynamics (BP, Shell, TotalEnergies, Enel, EDF)
Market Size and Growoth Outlook
Carbon Trading Market size is expected to advance from USD 971.49 billion in 2025 to USD 7.33 trillion by 2035, registering a CAGR of more than 22.4% across 2026-2035. By 2026, the industry is anticipated to generate USD 1.17 trillion in revenue.
Get more details on this report
Request Free Sample ReportCarbon Trading Market Intelligence Snapshot
Regional Market Dynamics
Segment Momentum
Market Expansion Drivers
Leading Market Participants
Global Market Forecast Snapshot
Market Outlook
Regional and Segment Outlook
Market Growth Drivers and Industry Trends
The accelerating commitment of corporations and governments to reduce carbon emissions is a pivotal growth driver in the carbon trading market. Prominent companies such as Microsoft and Unilever are publicly pledging carbon neutrality, while governments like the European Union have enacted the European Green Deal to enforce stricter emissions targets. These initiatives intensify demand for carbon credits, driving market liquidity and innovation in verification technologies. For established market participants, this trend amplifies opportunities to expand service offerings, including carbon offset project development and enhanced trading platforms. New entrants can leverage evolving compliance requirements to introduce niche solutions or focus on emerging eco-friendly sectors. As these efforts deepen, the carbon trading market will increasingly become a critical mechanism for quantifying and incentivizing emission reductions, embedding itself within broader sustainability strategies at both corporate and national levels.
Growth of Voluntary and Compliance Carbon Markets
The simultaneous expansion of voluntary and compliance carbon markets is reshaping the carbon trading market’s structure and reach. Compliance markets, exemplified by California’s Cap-and-Trade Program, enforce emissions limits, while voluntary markets driven by entities such as the Taskforce on Scaling Voluntary Carbon Markets provide additional flexibility for beyond-compliance commitments. This dual growth broadens participation from regulated industries to voluntary corporate buyers motivated by consumer and shareholder pressures for sustainability. Established players can capitalize on this by integrating regulatory data with voluntary credit offerings, enhancing transparency and trust. Meanwhile, new entrants are positioned to innovate with blockchain and AI-enabled platforms to streamline credit issuance and monitoring. The expanding markets are setting standards that will make carbon trading increasingly robust and accessible worldwide.
Adoption of Carbon Trading Frameworks in Emerging Markets
Emerging markets adopting carbon trading frameworks are unlocking new dimensions of the carbon trading market’s expansion. Countries like China and South Africa are moving toward nationwide emission trading systems, which introduce vast potential pools of credits and participants previously untapped. This adoption is influenced by growing environmental awareness and international agreements such as the Paris Accord, fostering a regulatory and market environment conducive to sustainable growth. For established players, this signals opportunities to form partnerships or acquire local market intelligence firms to navigate regulatory nuances. New entrants can target infrastructure gaps by providing technology for transparent transaction recording or capacity-building services. These developments indicate the carbon trading market’s evolution into a more globally integrated system, with emerging economies playing a central role in its future dynamics.
Industry Restraints:
Fragmented Regulatory Frameworks
Divergent carbon trading regulations across key economies significantly impede market cohesion and scalability. Disparate rules and reporting standards, as highlighted in the International Carbon Action Partnership’s 2023 summary, create operational inefficiencies and raise compliance costs for multinational firms, hindering seamless credit transfers and price transparency. The European Union Emissions Trading System (EU ETS) offers a relatively mature model, yet its limited compatibility with emerging markets like China’s national ETS poses barriers for global firms seeking integrated strategies. This regulatory fragmentation complicates entry for new participants lacking resources to navigate complex jurisdictions and diminishes investor confidence amid policy uncertainty. Going forward, unless International bodies and major governments accelerate harmonization efforts, regulatory discordance will continue to constrain carbon trading liquidity and inhibit deeper market integration in the medium term.
Verification and Transparency Challenges
Uncertainties around emissions data accuracy and third-party verification undermine trust and market depth in carbon trading. The World Bank’s State and Trends of Carbon Pricing 2023 report underscores how inconsistent monitoring, reporting, and verification (MRV) mechanisms fuel skepticism among buyers, slowing demand for credits. Cases of alleged greenwashing—exemplified by scrutiny of certain voluntary carbon offset projects critiqued by Carbon Plan—highlight these vulnerabilities. Established traders face reputational risks, while smaller market entrants struggle with the cost burdens of robust MRV compliance, limiting their competitiveness. Persistent challenges in transparency stall pricing efficiency and risk market fragmentation due to uneven credit quality perceptions. Continuous advancements in blockchain-based tracking and tighter third-party auditing protocols are expected to mitigate these issues gradually, yet full resolution will likely span several years, shaping cautious market participation in the near future.
| Growth Driver | Impact on CAGR | Regulatory Influence | Geographic Relevance | Adoption Rate | Impact Timeline |
|---|---|---|---|---|---|
| Increasing corporate and governmental carbon emission reduction initiatives | 8.00% | Short term (≤ 2 yrs) | Europe, North America | High | Fast |
| Growth of voluntary and compliance carbon markets | 7.00% | Medium term (2–5 yrs) | Europe, Asia Pacific | Medium | Moderate |
| Adoption of carbon trading frameworks in emerging markets | 5.50% | Long term (5+ yrs) | Asia Pacific, Latin America | Medium | Slow |
Unlock insights tailored to your business with our bespoke market research solutions.
Click to get your customized report now.
Regional Demand Dynamics
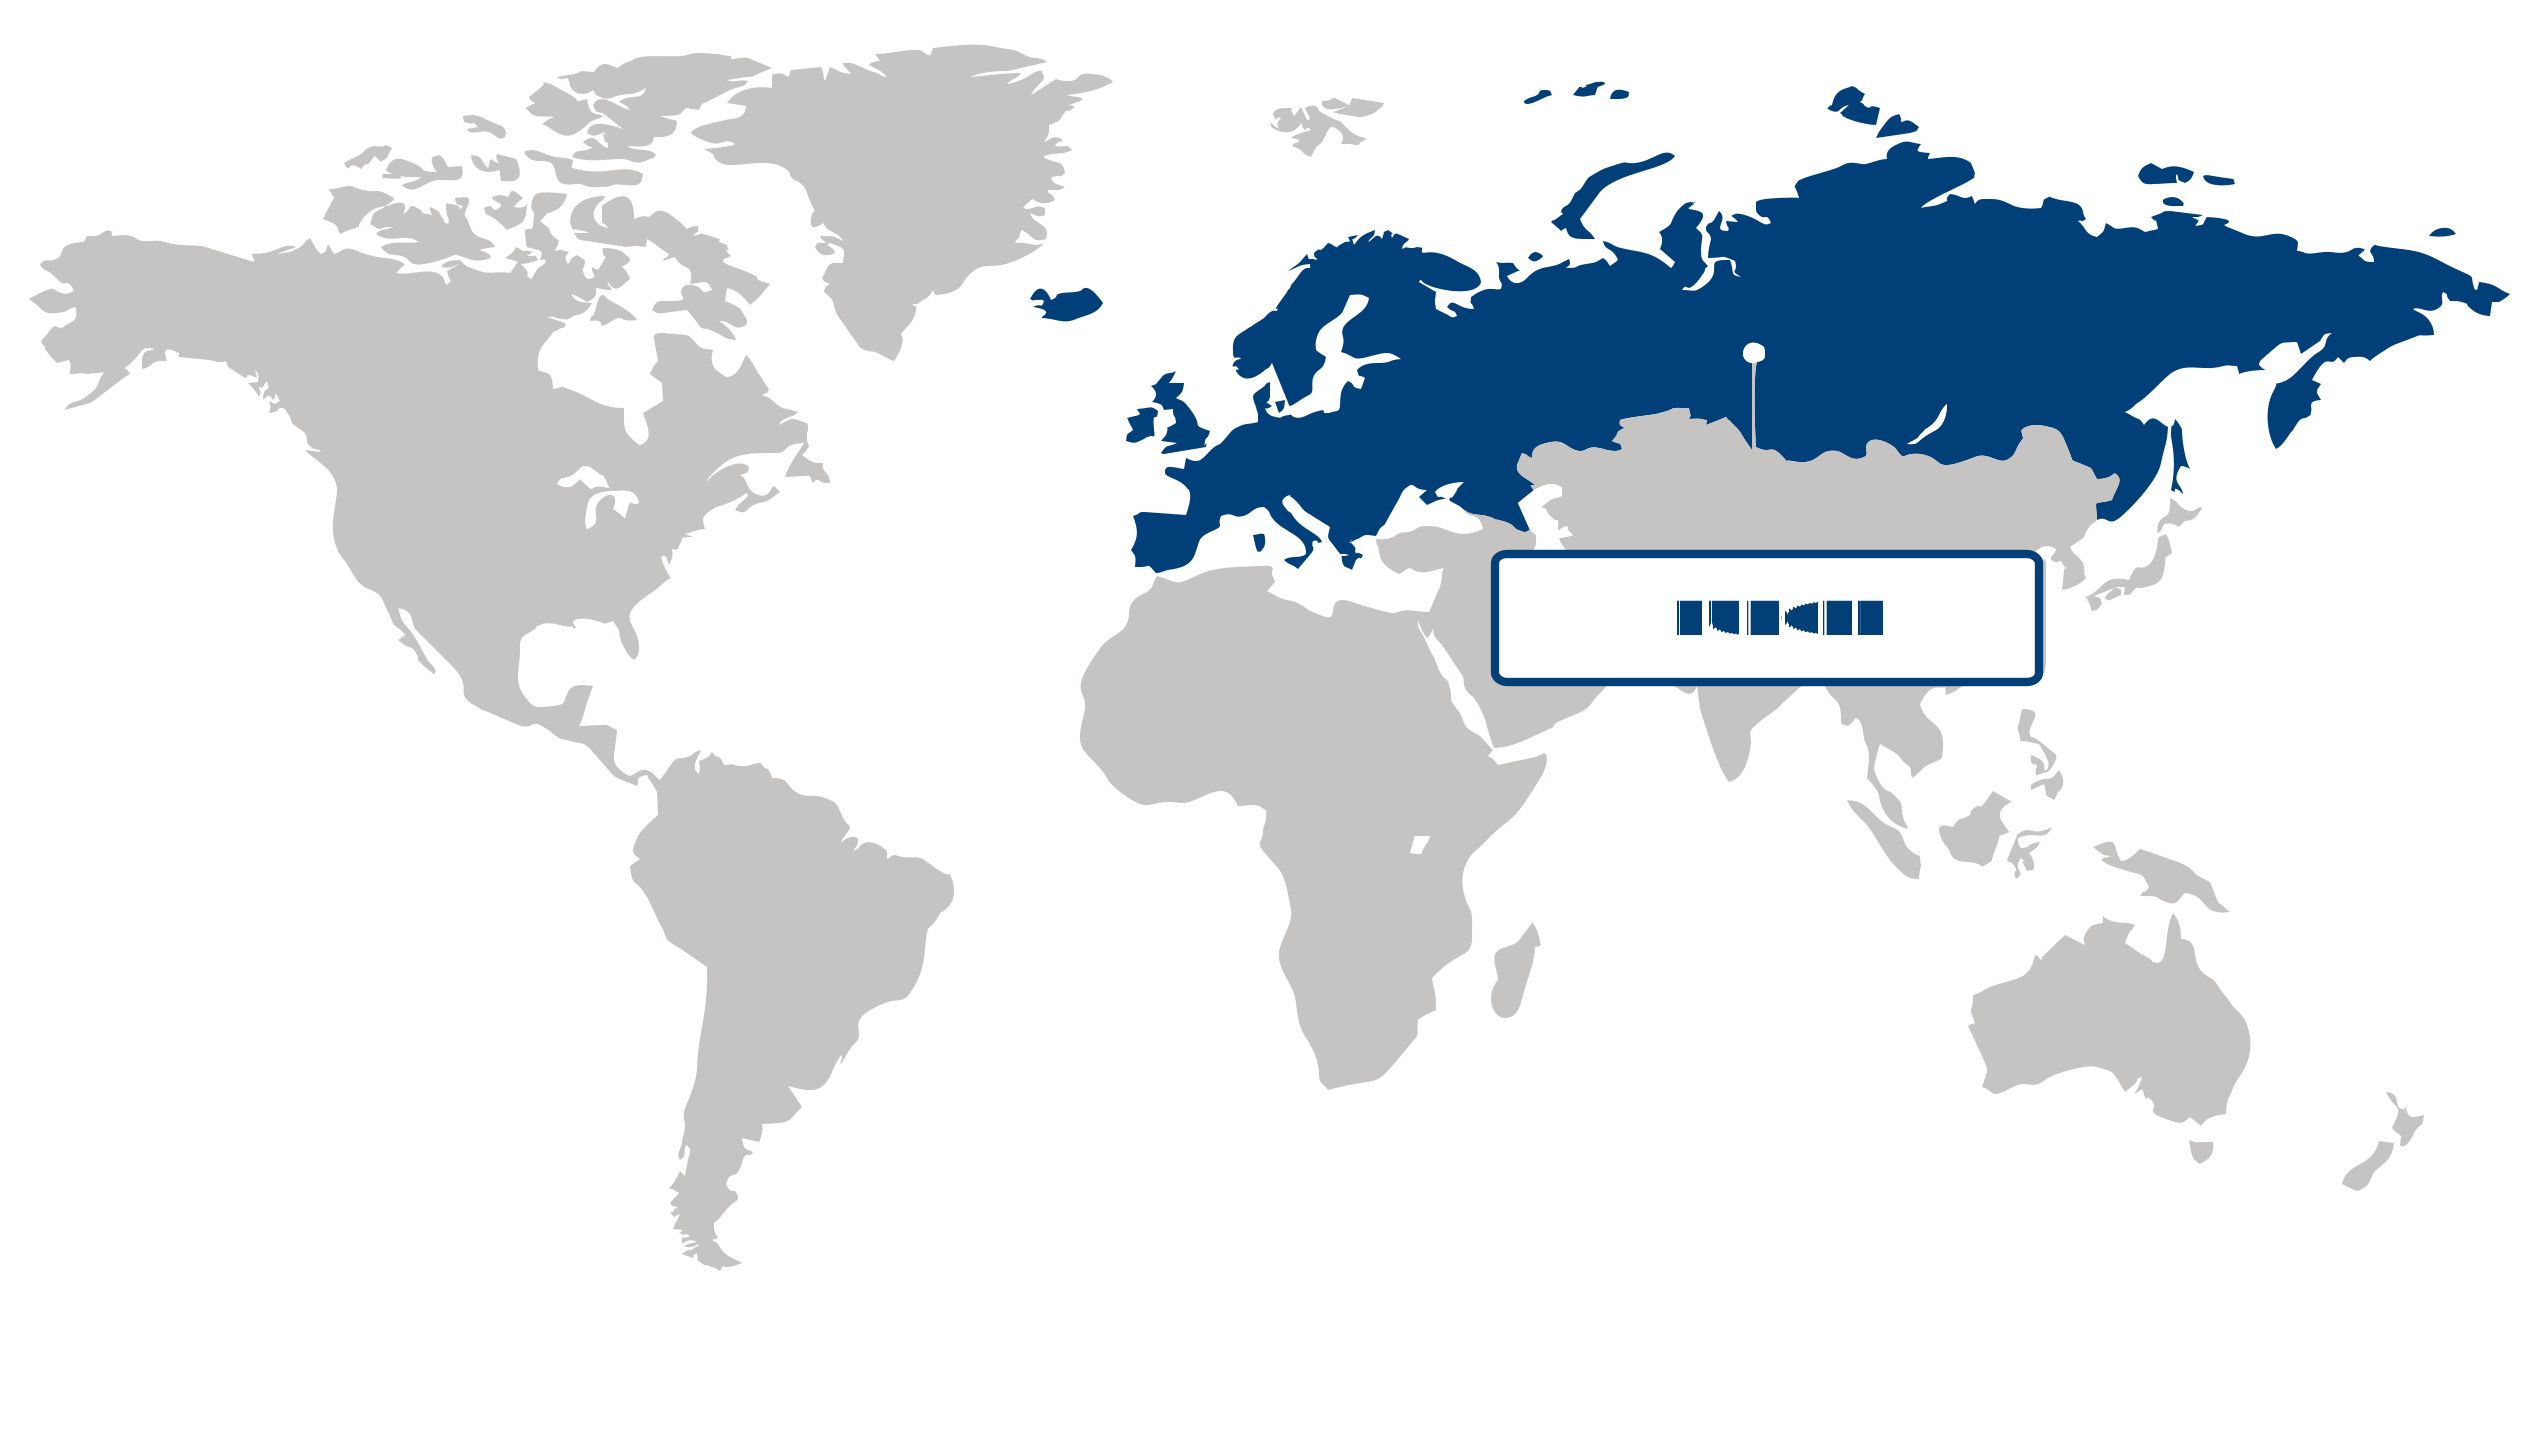
Europe dominated the carbon trading market in 2025, representing more than 45% of the global share. This region leads primarily due to its well-established emissions trading systems and stringent climate regulations spanning industries such as energy, manufacturing, and transportation. For instance, the European Union Emissions Trading System (EU ETS), the world’s largest carbon market, enforces rigorous caps and trade limits, fostering substantial demand for carbon credits. Regulatory bodies like the European Commission continue tightening compliance requirements, driving companies to adopt sustainable practices and invest in low-carbon technologies. Economic resilience combined with progressive sustainability policies has attracted intensified market participation, as evidenced by initiatives reported by the International Energy Agency (IEA). Europe’s advanced digital infrastructure supports efficient transaction oversight and transparency. Going forward, rising ambitions in decarbonization and evolving cross-border cooperation protocols make Europe a pivotal arena for carbon trading growth and innovation.
Germany anchors the European carbon trading market with its high industrial output and leadership in renewable energy adoption. The country’s commitment to climate neutrality by 2045, endorsed through policies by the German Environment Agency (UBA), reinforces demand for carbon allowances and credits. Germany’s corporate sector increasingly integrates carbon cost considerations in investment strategies, driving sophisticated trading behaviors. Furthermore, innovations by firms such as Siemens Energy in carbon capture and storage technologies signal evolving market dynamics. These developments demonstrate Germany’s critical role in sustaining the regional carbon trading ecosystem by combining regulation, advanced technology, and industrial transformation.
France plays a strategic role in Europe’s carbon trading market through comprehensive climate action plans and regulatory frameworks, particularly in transportation and energy sectors. The French Ministry of Ecological Transition’s enforceable emissions reduction targets stimulate corporate engagement in carbon offsetting and trading activities. France also leverages its participation in the EU ETS while exploring complementary national carbon pricing mechanisms, as highlighted by ADEME’s reports. Its investments in green infrastructure and smart grid technologies underscore growing market sophistication. France’s active participation in carbon market reforms and innovation ecosystems positions it as a key facilitator of Europe’s expanding opportunities in carbon trading, reinforcing regional leadership in sustainable investment flows.
Asia Pacific Market Analysis:
Asia Pacific emerged as the fastest-growing region in the carbon trading market, registering a rapid CAGR of 25.6%. This remarkable growth is primarily driven by the expansion of national carbon markets, rising environmental, social, and governance (ESG) compliance, and concerted government-led decarbonization initiatives. Countries across Asia Pacific are increasingly focusing on reducing their carbon footprints through mandatory and voluntary carbon trading schemes, supported by progressive regulatory frameworks and incentivized emission reduction targets. For instance, the International Energy Agency (IEA) highlights China's national carbon market as the largest globally, which significantly influences regional dynamics. Furthermore, companies throughout the region are enhancing sustainability disclosures, responding to investors’ growing preference for ESG-compliant enterprises. The integration of advanced monitoring technologies and digital platforms also streamlines carbon credit trading, reinforcing market liquidity and transparency. Looking ahead, Asia Pacific offers substantial opportunities as economic resilience and evolving policies continue to propel the adoption of carbon trading mechanisms, positioning the region at the forefront of the global low-carbon transition.
China plays a critical role in advancing the carbon trading market in Asia Pacific due to its expansive national carbon market launched by the Ministry of Ecology and Environment. This platform covers major industrial sectors and sets a benchmark for emission reductions, influencing both domestic firms and regional players. Demand for carbon credits in China is driven by increasingly stringent regulatory requirements and growing pressure from international investors emphasizing ESG compliance, as reported in recent disclosures by China’s Listed Companies Association. Technological innovation, such as blockchain implementation for transparent credit registries, further enhances trading efficiency. These efforts make China a pivotal force in shaping the regional market landscape, facilitating economies of scale and market sophistication.
Japan distinguishes itself with robust government-led decarbonization initiatives, spearheaded by the Ministry of the Environment, which include promoting voluntary emissions trading and carbon offset programs across both public and private sectors. Japanese corporations are adopting aggressive carbon reduction targets aligned with the country’s net-zero commitment by 2050, influenced by consumer preference shifts towards sustainable products and services. The Tokyo Cap-and-Trade Program, devised by the Tokyo Metropolitan Government, exemplifies localized market mechanisms effective in driving emission reductions. This coordinated regulatory environment fosters an ecosystem conducive to sustainable investments, reinforcing Japan’s contribution to Asia Pacific’s leadership in carbon trading. Together, the experiences of China and Japan cement Asia Pacific’s strategic advantage in the global carbon trading market.
North America Market Trends:
North America maintained notable presence in the carbon trading market, driven by evolving regulatory frameworks and increasing corporate sustainability commitments. The region’s mix of stringent emissions policies, especially in states like California, and a robust industrial base has stimulated consistent demand for carbon credits. Evolving consumer preferences toward environmentally responsible products, coupled with advanced digital platforms for carbon asset management, have enhanced market transparency and participation. The California Air Resources Board’s implementation of the Cap-and-Trade Program exemplifies regulatory sophistication encouraging market liquidity and innovation. These dynamics, alongside growing participation from private enterprises aiming to meet ambitious net-zero targets, position North America as a pivotal arena for carbon trading expansion, promising significant opportunities for investors and strategists seeking to leverage regulatory momentum and technological integration.
The U.S. plays a central role in the North American carbon trading market, with its multi-state initiatives and federal environmental agenda fostering deeper market integration. The Environmental Protection Agency’s (EPA) recent updates to carbon reporting standards have catalyzed broader adoption of trading mechanisms among industries, enhancing market depth. Corporate announcements from firms like Microsoft and Shell highlight increasing voluntary carbon credit procurement, reflecting heightened demand for verified emissions reductions aligned with ESG goals. Moreover, infrastructure investments supporting blockchain-enabled trading platforms, as seen with ClimateTrade’s U.S. expansion, underscore technological progress facilitating efficient transactions. Strategically, the U.S. market’s scale and innovation serve as a key driver for shaping regional carbon trading developments, offering a model that neighboring countries may emulate to amplify market growth across North America.
| Parameter | North America | Asia Pacific | Europe | Latin America | MEA |
|---|---|---|---|---|---|
| Innovation Hub i Scale Nascent Developing Advanced | |||||
| Cost-Sensitive Region i Scale Low Medium High | |||||
| Regulatory Environment i Scale Restrictive Neutral Supportive | |||||
| Demand Drivers i Scale Weak Moderate Strong | |||||
| Development Stage i Scale Emerging Developing Developed | |||||
| Adoption Rate i Scale Low Medium High | |||||
| New Entrants / Startups i Scale Sparse Moderate Dense | |||||
| Macro Indicators i Scale Weak Stable Strong |
Segment Leadership and Growth Trends
Carbon Trading Market Share (%), Carbon Credit Type, 2025
Go beyond the chart, access full insights & data tables
Request Free Sample ReportKyoto Credits represented the largest share in the carbon trading market in 2025, driven predominantly by strong regulatory support and the presence of well-established international frameworks such as the Kyoto Protocol. This segment benefits from global recognition and formalized compliance mechanisms, which encourage participation from governments and regulated industries. The preference for Kyoto Credits reflects a growing commitment among multinational corporations and national entities to adopt proven offsetting instruments that align with stringent emissions targets. According to the United Nations Framework Convention on Climate Change (UNFCCC), structured monitoring and verification standards for Kyoto Credits further bolster their credibility. This segment offers strategic opportunities for established environmental consultancies and emerging technology providers specializing in emissions verification. Given continued international regulatory backing and evolving carbon accounting practices, Kyoto Credits are poised to maintain their central role in carbon markets, reinforcing compliance and sustainability strategies in the near to medium term.
Analysis by Carbon Market Type
Cap-and-Trade held the largest share in the carbon trading market in 2025, fueled by the expansion of stringent climate policies and mandatory emission limits enacted by governments worldwide. The segment’s leadership stems from its market-based mechanism that incentivizes emission reductions while providing flexibility for corporations to optimize compliance costs. Growing demand in regions such as the European Union and California, supported by regulatory agencies like the European Commission and the California Air Resources Board, underscores the effectiveness of cap-and-trade schemes. These frameworks are increasingly integrated with corporate ESG targets, encouraging greater participation from energy-intensive sectors. The evolving regulatory landscape and increasing carbon pricing signals create opportunities for technology firms offering data analytics and risk management solutions tailored to cap-and-trade markets. With ongoing legislative commitments to carbon neutrality, this segment will remain critical for emission control strategies and investor interest in the foreseeable future.
Analysis by Trading Platform
The exchange-based segment held the largest share in the carbon trading market in 2025, supported by growing corporate sustainability commitments and a shift toward digital platforms that improve transaction transparency and market liquidity. This segment benefits from advances in trading technologies and heightened demand for standardized, verifiable carbon credits where exchanges such as the European Energy Exchange (EEX) and the Shanghai Environment and Energy Exchange play pivotal roles. Investor confidence is reinforced by these platforms’ ability to facilitate real-time pricing and enhance market accessibility, appealing to both legacy players and new entrants. These marketplaces enable more efficient price discovery and risk management, attracting financial institutions and sustainability-focused asset managers. The ongoing digital transformation and increasing regulatory encouragement for transparent emissions accounting position exchange-based platforms as indispensable infrastructure, sustaining their dominance amid evolving market sophistication and globalization pressures.
| Segment | Sub-Segment | Largest Segment | Fastest Growing |
|---|---|---|---|
| Carbon Credit Type | Kyoto Credits, CERs/ERs, VERs, CCERs | ||
| Carbon Market Type | Cap-and-Trade, Offset-Based, Baseline-and-Credit, Tax-Based | ||
| Trading Platform | Exchange-based, Over-the-Counter (OTC), Bilateral Contracts, Auction Platforms, Registry-Based Systems | ||
| Application | Compliance, Voluntary Offsetting, Carbon Finance, Risk Management, Speculative Trading | ||
| Methodology | Project-Based, Sector-Based, Jurisdictional, Technology-Based, Nature-Based Solutions |
Competitive Landscape and Market Positioning
The competitive landscape is characterized by dynamic maneuvers including strategic collaborations and asset consolidations, enhancing footholds in evolving regulatory environments. Enterprises are intensifying technology deployments for accurate emissions tracking and transparency, thus differentiating their carbon credit offerings. Cross-sector partnerships, particularly between energy giants and trading specialists, are fostering holistic market solutions that address compliance and voluntary initiatives alike. Furthermore, investments in digital platforms and blockchain technology streamline transactional efficiency and build stakeholder trust, underscoring a collective pursuit of market leadership grounded in innovation and operational agility.
Strategic / Actionable Recommendations for Regional Players
In North America, entities can capitalize on forging alliances that blend upstream energy operations with green technology firms to enhance carbon asset portfolios and engage in emerging sub-markets such as carbon offsets linked to agricultural practices. This approach could nurture competitive resilience amid increasing regulatory scrutiny.
Within the Asia Pacific, emphasizing partnerships with technology innovators to adopt cutting-edge monitoring and verification systems could elevate credibility and market penetration. Embracing digital infrastructure might unlock new client segments, particularly in rapidly industrializing economies prioritizing emission reduction commitments.
For Europe, market participants should consider intensifying integration with renewable energy developers, leveraging the region’s progressive climate policies. Expanding involvement in cross-border trading platforms will facilitate access to diverse credit pools, reinforcing strategic positioning while responding to heightened environmental standards.
| Company | Market Share | Company Revenue | Revenue CAGR (%) | Product Portfolio | Geographic Presence | Innovation / R&D Focus | Strategic Developments |
|---|---|---|---|---|---|---|---|
| No companies available. | |||||||
Industry Development/News
| Company Name | Date | Key Development |
|---|
Explore This Report
Click a section of the wheel — or its numbered marker — to preview the custom segmentation, custom table of contents, or related reports available for this market.
Carbon Trading Market — Custom Segments
| Segment | Sub-Segment |
|---|---|
| No segment data available. | |
Carbon Trading Market — report.custom
| Custom Chapter | Custom Details | ||
|---|---|---|---|
| No custom TOC data available. | |||
Need a different cut of the data?
Request Custom ResearchWhat is the projected value of the carbon trading industry by 2035?
Which territory dominates the carbon trading market share rankings?
Which geography represents the strongest growth trajectory for the carbon trading sector?
When did kyoto credits sub-segment emerge as the largest sub-segment in the carbon credit type segment of carbon trading sector?
Why is the cap-and-trade segment leading in the carbon trading industry?
Why does exchange-based sub-segment dominate the trading platform segment of carbon trading sector?
How much is the compliance segment expected to grow in the carbon trading industry beyond 2025?
What factors give project-based segment a competitive edge in the carbon trading sector?
Who are the leading players in the carbon trading landscape?
Our Clients
"The reports offered a comprehensive view of the Food and Beverage landscape, covering market trends, consumer behavior, and competitive dynamics."
"Our experience in acquiring market research reports has been outstanding — the depth of analysis and actionable insights have proven invaluable."
"Fundamental Business Insights demonstrated a keen understanding of our business needs, delivering reports tailored to our specific objectives."
Our Research Team & Methodology
Every Fundamental Business Insights report is built by a dedicated vertical research team, validated through a structured primary-and-secondary methodology, and reviewed for accuracy before it reaches you.
Research Team Overview
Prepared by the Energy & Power Research Team
Delivery
Published
Demand
Available
Support
Trust & Compliance
Research Domains
10 coverage areasResearch Intelligence
| Source Category | Research Sources | Purpose |
|---|---|---|
| Government Publications | Government agencies, statistical departments, regulatory bodies | Industry statistics, regulatory insights, and policy analysis |
| Company Disclosures | Annual reports, investor presentations, financial filings | Company performance, business strategy, and market positioning |
| Trade Associations | Industry associations and professional organizations | Industry developments, standards, and market perspectives |
| Technical Literature | Research papers, technical publications, academic journals | Technology developments and technical validation |
| Patent Analysis | Patent databases and intellectual property publications | Innovation trends, technology activity, and competitive research |
| Industry Databases | Established research databases and market intelligence resources | Market benchmarking, historical data, and industry analysis |
Research Workflow & Quality Assurance
Data Collection
Verified information gathered through primary and secondary research.
Data Triangulation
Cross-validation using multiple independent data sources.
Forecast Modelling
Market estimates developed using historical trends and analytical models.
Analyst Validation
Findings reviewed by domain experts for accuracy and consistency.
Editorial & Quality Review
Final editorial, quality, and compliance checks before publication.
Final Publication
Released after successful completion of the internal review process.
Report Coverage
📊 Market Assessment
- Market Size & Forecast
- Market Segmentation
- Regional Analysis
- Growth Drivers & Challenges
- Market Dynamics
🏢 Competitive Intelligence
- Competitive Landscape
- Company Profiles
- Competitive Benchmarking
- Mergers & Acquisitions
- Market Share Analysis or Key Company Strategies
🔍 Strategic Analysis
- Value Chain Analysis
- Porter's Five Forces
- PESTLE Analysis
- Pricing Trends
- Supply-Demand Analysis
🚀 Future Outlook
- Technology Landscape
- Regulatory Landscape
- Investment & Funding Landscape
- Emerging Opportunities
- Future Market Outlook
Have a question about this report or need a custom scope?
Request Customization