Non-Carbonated Soft Drinks Market Size & Growth Forecast 2026–2035, By Segments (Product, Distribution Channel), Regional Demand Trends (North America, Asia Pacific, Europe), Key Country Insights (U.S., Japan, South Korea, Germany, France, Italy), and Competitive Landscape
Market Size and Growoth Outlook
Non-Carbonated Soft Drinks Market size was worth USD 165.18 Billion in 2025 and is expected to grow at a 7% CAGR between 2026 and 2035, surpassing USD 324.93 Billion by 2035. The industry revenue for 2026 is assessed at USD 175.29 billion.
Get more details on this report
Request Free Sample ReportNon-Carbonated Soft Drinks Market Intelligence Snapshot
Regional Market Dynamics
- Asia Pacific held a 32.40% share in 2025, supported by a large consumer base, extensive retail distribution, and strong demand across juices, ready-to-drink tea, bottled water, and functional beverages.
- North America is forecast to expand at a 7.91% CAGR as consumers increasingly choose low-sugar, functional, plant-based, and enhanced hydration beverages supported by continuous product innovation.
Segment Momentum
- RTD beverages held a 76.8% share in 2025 due to their convenience, broad consumer familiarity, and strong retail presence that supports consistent everyday purchasing.
- Sparkling & Flavored Water is the fastest-growing product segment as consumers increasingly choose refreshing, flavorful alternatives to traditional sweetened soft drinks.
Market Expansion Drivers
- Shift toward low-sugar hydration beverages driving demand for functional non-carbonated drinks.
- Rapid flavor innovation and functional ingredient integration enhancing product differentiation.
- Expansion of on-the-go consumption channels boosting ready-to-drink beverage penetration.
Leading Market Participants
Global Market Forecast Snapshot
Market Outlook
Leading companies in the non-carbonated soft drinks market include The Coca-Cola Company (United States), PepsiCo, Inc. (United States), Keurig Dr Pepper Inc. (United States), Red Bull GmbH (Austria), Monster Beverage Corporation (United States), Nestlé S.A. (Switzerland), AriZona Beverages USA LLC (United States), Unilever PLC (United Kingdom), Hint Inc. (United States), Spindrift Beverage Co., Inc. (United States).Regional and Segment Outlook
Asia PacificMarket Growth Drivers and Industry Trends
As consumers reduce intake of sugary carbonated beverages, purchasing is shifting toward drinks positioned around hydration, light refreshment, and added wellness benefits, directly supporting expansion of the non-carbonated soft drinks market. This trend is strongest in categories such as flavored water, sports drinks, electrolyte beverages, and vitamin-enhanced formats, where low-sugar or reduced-sugar formulations align with everyday consumption rather than occasional indulgence. In practice, the non-carbonated soft drinks market benefits because brands can capture repeat usage occasions tied to work, fitness, commuting, and general hydration, while functional claims such as electrolyte balance, energy support, or immunity reinforcement increase willingness to trade up from plain bottled water.
Rapid flavor innovation and functional ingredient integration enhancing product differentiation
Product competition in the non-carbonated soft drinks market is increasingly shaped by the ability to stand out through new flavor profiles and targeted functional additions, rather than relying only on brand recognition or conventional refreshment positioning. Flavor innovation helps companies keep shelves dynamic and attract consumers seeking novelty, while ingredients such as vitamins, botanicals, caffeine, probiotics, or electrolytes allow brands to define more specific use cases and consumption occasions. This combination strengthens market development by enabling premiumization, sharper segmentation, and faster response to changing consumer preferences, giving retailers more reasons to expand assortment and giving manufacturers a clearer route to defend margins in crowded beverage categories.
Expansion of on-the-go consumption channels boosting ready-to-drink beverage penetration
Growth in convenience-led retail environments is increasing the visibility and purchase frequency of portable beverage formats, which is reinforcing demand in the non-carbonated soft drinks market. Ready-to-drink teas, juices, sports drinks, flavored waters, and functional beverages are well suited to convenience stores, vending, travel hubs, quick-service food outlets, and grab-and-go sections because they meet immediate consumption needs without preparation. The practical effect is stronger market penetration through impulse purchases and single-serve sales, with packaging, shelf placement, and cold-chain availability playing a central role in converting everyday mobility into repeat buying behavior.
| Growth Driver | Impact on CAGR | Regulatory Influence | Geographic Relevance | Adoption Rate | Impact Timeline |
|---|---|---|---|---|---|
| Consumer shift toward healthier beverage alternatives | 2.60% | Short term (≤ 2 yrs) | North America, Europe (spillover: Asia Pacific) | Medium | Fast |
| Rising demand for flavored & fortified water/juices | 2.40% | Medium term (2–5 yrs) | Asia Pacific, North America (spillover: Europe) | Low | Moderate |
| Regulatory push against sugar-sweetened beverages | 2.00% | Long term (5+ yrs) | Europe, North America (spillover: Asia Pacific) | High | Slow |
| Shift toward low-sugar hydration beverages driving demand for functional non-carbonated drinks | 2.10% | Moderate | Asia Pacific, North America | High | Near Term |
| Rapid flavor innovation and functional ingredient integration enhancing product differentiation | 1.70% | Low | Asia Pacific, Europe | High | Near Term |
| Expansion of on-the-go consumption channels boosting ready-to-drink beverage penetration | 1.40% | Low | Middle East & Africa, Asia Pacific | High | Mid Term |
Unlock insights tailored to your business with our bespoke market research solutions.
Click to get your customized report now.
Regional Demand Dynamics
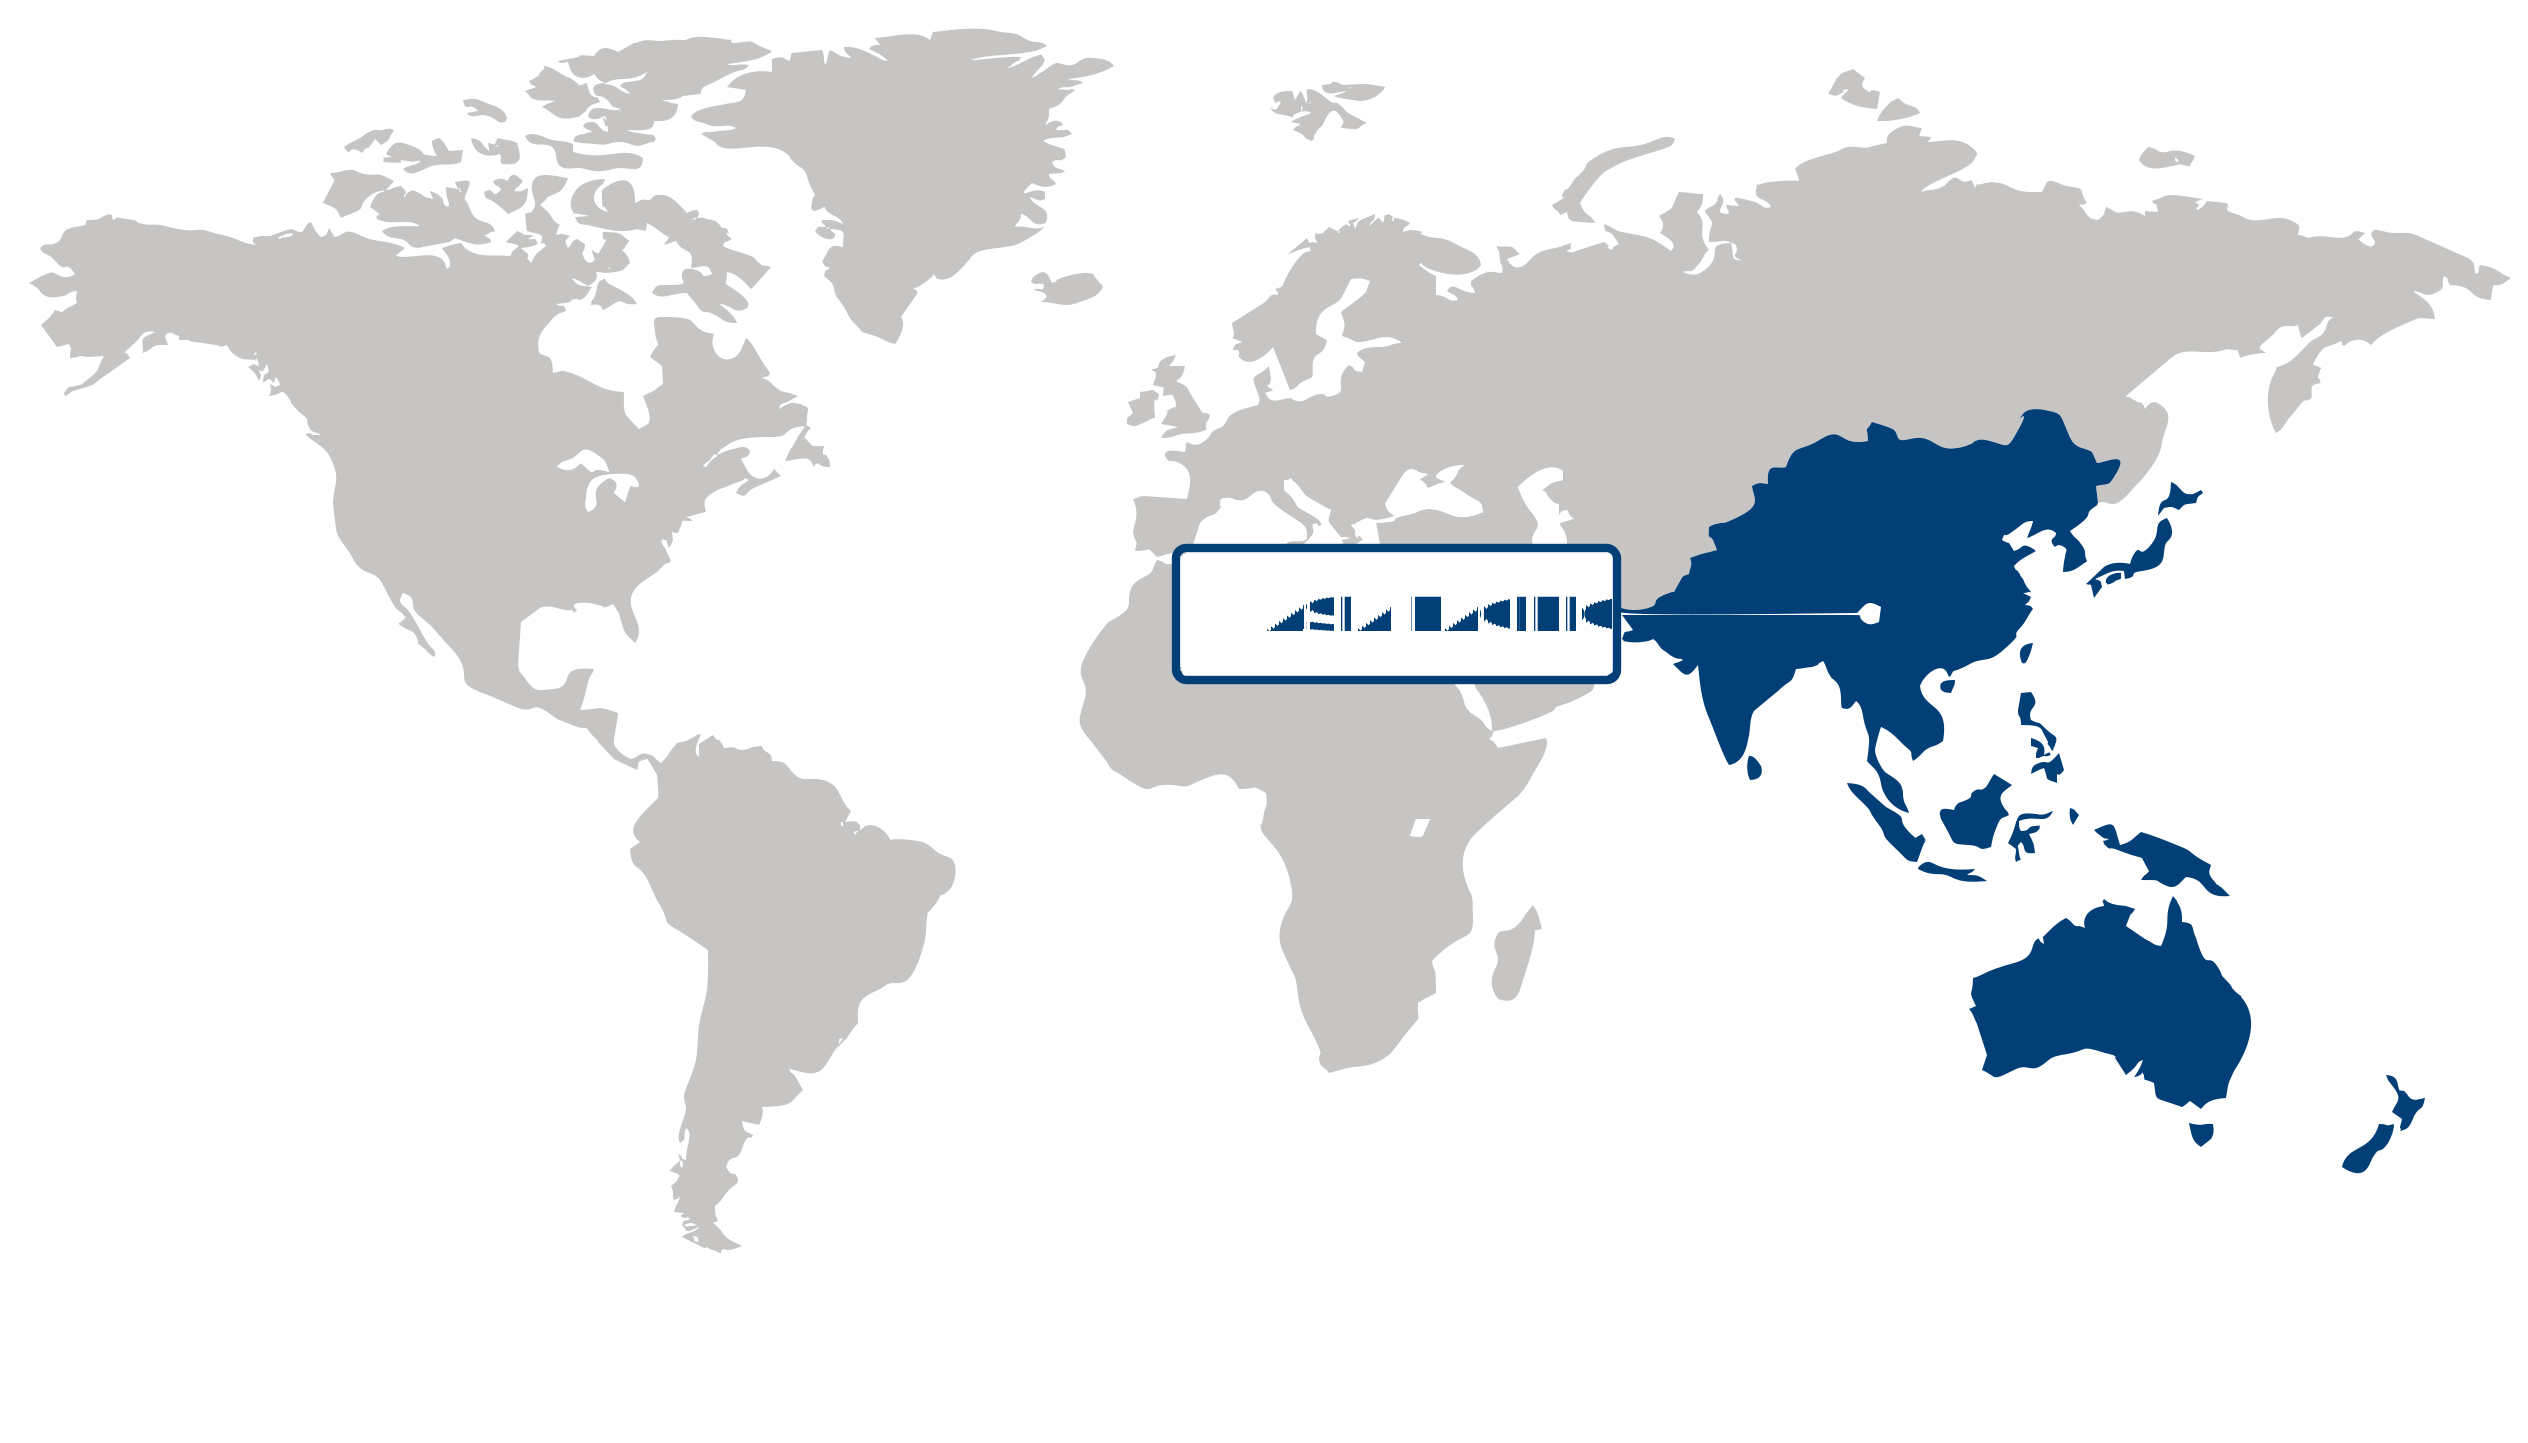
Asia Pacific held a 32.40% share of the non-carbonated soft drinks market in 2025, backed by its large consumer base and broad everyday consumption across categories such as juices, ready-to-drink tea, functional beverages, and bottled water. The region’s leadership is strengthened by high-volume retail distribution spanning modern trade, convenience outlets, and traditional neighborhood stores, which keeps products widely accessible across both urban and semi-urban areas. Demand is also sustained by frequent product turnover at mass-market price points, allowing manufacturers to serve varied income groups while maintaining strong shelf presence.
North America is projected to expand at a 7.91% CAGR over the forecast period, with the non-carbonated soft drinks market gaining momentum from steady consumer movement toward health-oriented and convenience-led beverage choices. Growth is being propelled by stronger adoption of low-sugar, functional, plant-based, and enhanced hydration products, particularly as buyers increasingly evaluate beverages on ingredients, wellness positioning, and daily usability. Product innovation is translating quickly into market activity through established retail chains, e-commerce channels, and premium grocery formats, giving new formulations and brand extensions faster commercial traction.
| Parameter | North America | Asia Pacific | Europe | Latin America | MEA |
|---|---|---|---|---|---|
| Innovation Hub i Scale Nascent Developing Advanced | |||||
| Cost-Sensitive Region i Scale Low Medium High | |||||
| Regulatory Environment i Scale Restrictive Neutral Supportive | |||||
| Demand Drivers i Scale Weak Moderate Strong | |||||
| Development Stage i Scale Emerging Developing Developed | |||||
| Adoption Rate i Scale Low Medium High | |||||
| New Entrants / Startups i Scale Sparse Moderate Dense | |||||
| Macro Indicators i Scale Weak Stable Strong |
Key Country Insights
Germany 🇩🇪
Health-Conscious RefreshmentsGermany favors non-carbonated beverages with natural ingredients, low sugar content, and transparent labeling. German beverage companies continue refining formulations that balance taste, nutritional value, and evolving consumer expectations for healthier refreshment options.
France 🇫🇷
Natural Ingredient AppealFrance emphasizes premium non-carbonated beverages featuring natural fruit extracts and clean-label positioning. French beverage producers continue innovating with authentic flavors while responding to increasing demand for minimally processed refreshment options.
Italy 🇮🇹
Authentic Flavor PortfolioItaly maintains strong consumer interest in fruit juices, iced teas, and botanical beverages that reflect local taste preferences. Italian beverage manufacturers focus on ingredient quality and product innovation across supermarkets, cafés, and convenience retail outlets.
Japan 🇯🇵
Everyday Wellness DrinksJapan integrates functional teas, vitamin-enriched beverages, and sports drinks into everyday consumption habits. Beverage manufacturers focus on convenient packaging and scientifically supported ingredients that complement active lifestyles and preventive health preferences.
South Korea 🇰🇷
Trend-Driven Beverage InnovationSouth Korea responds to changing consumer lifestyles with fruit-based drinks, functional beverages, and premium hydration products. Local companies introduce distinctive flavors and wellness-oriented formulations that strengthen product differentiation across retail channels.
United States 🇺🇸
Functional Beverage ExpansionThe U.S. non-carbonated soft drinks market continues diversifying through functional beverages, ready-to-drink teas, enhanced waters, and reduced-sugar products. Beverage manufacturers prioritize wellness-focused formulations alongside convenient packaging and broad retail availability.
Segment Leadership and Growth Trends
Non-Carbonated Soft Drinks Market Share (%), Product, 2025
Go beyond the chart, access full insights & data tables
Request Free Sample ReportRTD held the leading position in the non-carbonated soft drinks market in 2025, accounting for a 76.8% share. Its dominance is sustained by broad consumer familiarity, immediate consumption convenience, and strong placement across mainstream retail channels where ready-to-drink formats align well with routine purchase behavior. The segment also benefits from operational simplicity for retailers and beverage suppliers, since RTD products fit established merchandising, refrigeration, and inventory patterns that support consistent volume movement in the non-carbonated soft drinks market.
Sparkling & Flavored Water is emerging as the fastest-growing product segment in the non-carbonated soft drinks market as consumer preference shifts toward lighter, more refreshing beverages that still offer taste variety. Its momentum is supported by its ability to attract buyers looking for an alternative to more traditional sweetened soft drink options without moving outside convenient packaged beverage formats. Compared with established product categories, Sparkling & Flavored Water is gaining faster traction because it meets changing taste expectations while remaining easy to position in both everyday hydration and on-the-go consumption occasions.
Distribution Channel Segment Analysis: Hypermarkets and Supermarkets (Largest Segment) vs Online (Fastest-Growing Segment)
In 2025, Hypermarkets and Supermarkets represented the largest distribution channel in the non-carbonated soft drinks market, with a 42.4% share. This leadership is anchored in high product visibility, broad brand assortment, and the convenience of one-stop purchasing, which suits beverage buying patterns that are often planned alongside regular grocery trips. The channel also supports bulk purchases and promotional merchandising effectively, helping it retain a strong share in the non-carbonated soft drinks market where in-store comparison and immediate product availability remain important.
Online is the fastest-growing distribution channel in the non-carbonated soft drinks market as purchasing behavior increasingly shifts toward digital convenience and home delivery. Growth is being influenced by the practical advantage of ordering beverages without carrying heavy packs, which makes online channels especially attractive relative to physical retail for repeat household purchases. The channel is also gaining momentum as digital storefronts expand product discoverability and simplify replenishment, creating a smoother buying process than traditional alternatives for many consumers.
| Segment | Sub-Segment | Largest Segment | Fastest Growing |
|---|---|---|---|
| Product | RTD, Sparkling & Flavored Water | RTD | Sparkling & Flavored Water |
| Distribution Channel | Hypermarkets and Supermarkets, Convenience Store, Online, Others | Hypermarkets and Supermarkets | Online |
Competitive Landscape and Market Positioning
1. The Coca-Cola Company (United States)
2. PepsiCo Inc. (United States)
3. Keurig Dr Pepper Inc. (United States)
4. Red Bull GmbH (Austria)
5. Monster Beverage Corporation (United States)
6. Nestlé S.A. (Switzerland)
7. AriZona Beverages USA LLC (United States)
8. Unilever PLC (United Kingdom)
9. Hint Inc. (United States)
10. Spindrift Beverage Co. Inc. (United States)
Health-conscious consumption patterns are driving innovation in the non-carbonated soft drinks market, with manufacturers introducing functional beverages, natural ingredients, and reduced-sugar formulations. Product diversification continues to address changing consumer preferences for healthier refreshment options.
| Company | Market Share | Company Revenue | Revenue CAGR (%) | Product Portfolio | Geographic Presence | Innovation / R&D Focus | Strategic Developments |
|---|---|---|---|---|---|---|---|
| No companies available. | |||||||
Industry Development/News
| Company Name | Date | Key Development |
|---|---|---|
| SIG | Apr-25 | SIG expanded its aseptic packaging footprint by supplying four high-speed carton filling machines to LUBBC. This deployment significantly enhances regional manufacturing capacity for shelf-stable non-carbonated soft drinks, including juices and flavored beverages, by improving operational efficiency and supporting the scalability of aseptic packaging formats within the supply chain. |
| Coca-Cola | Jun-24 | Coca-Cola secured expanded distribution rights for the Evian brand in the United States following the dissolution of a joint venture with Danone. This development strengthens Coca-Cola’s competitive positioning in the premium bottled water category and consolidates its operational control over commercialization pathways within the U.S. hydration segment. |
| Grupo Jumex | Oct-25 | Grupo Jumex entered the standalone functional energy beverage category through a strategic partnership with AriZona Beverages. By leveraging AriZona’s established U.S. distribution network, the launch of this fruit-forward, functional energy line marks a significant expansion of Jumex’s portfolio into high-growth, non-carbonated drink segments targeted at active consumer demographics. |
Explore This Report
Click a section of the wheel — or its numbered marker — to preview the custom segmentation, custom table of contents, or related reports available for this market.
Non-Carbonated Soft Drinks Market — Custom Segments
| Segment | Sub-Segment |
|---|---|
| No segment data available. | |
Non-Carbonated Soft Drinks Market — report.custom
| Custom Chapter | Custom Details | ||
|---|---|---|---|
| No custom TOC data available. | |||
Need a different cut of the data?
Request Custom ResearchHow much is the non-carbonated soft drinks market worth?
What is the expected industry size of non-carbonated soft drinks by 2035?
How are shifting consumer preferences toward low-sugar hydration reshaping demand patterns in the non-carbonated soft drinks market?
What is driving the rapid expansion of online channels in the non-carbonated soft drinks market?
Why do ready-to-drink (RTD) beverages lead the non-carbonated soft drinks market?
Which product segment is growing fastest in the non-carbonated soft drinks market?
What makes Asia Pacific the largest regional market for non-carbonated soft drinks?
Why is North America the fastest-growing region for non-carbonated soft drinks?
What are the key competitors in the non-carbonated soft drinks landscape?
Our Clients
"The reports offered a comprehensive view of the Food and Beverage landscape, covering market trends, consumer behavior, and competitive dynamics."
"Our experience in acquiring market research reports has been outstanding — the depth of analysis and actionable insights have proven invaluable."
"Fundamental Business Insights demonstrated a keen understanding of our business needs, delivering reports tailored to our specific objectives."
Our Research Team & Methodology
Every Fundamental Business Insights report is built by a dedicated vertical research team, validated through a structured primary-and-secondary methodology, and reviewed for accuracy before it reaches you.
Research Team Overview
Prepared by the Food & Beverage Research Team
Delivery
Published
Demand
Available
Support
Trust & Compliance
Research Domains
10 coverage areasResearch Intelligence
| Source Category | Research Sources | Purpose |
|---|---|---|
| Government Publications | Government agencies, statistical departments, regulatory bodies | Industry statistics, regulatory insights, and policy analysis |
| Company Disclosures | Annual reports, investor presentations, financial filings | Company performance, business strategy, and market positioning |
| Trade Associations | Industry associations and professional organizations | Industry developments, standards, and market perspectives |
| Technical Literature | Research papers, technical publications, academic journals | Technology developments and technical validation |
| Patent Analysis | Patent databases and intellectual property publications | Innovation trends, technology activity, and competitive research |
| Industry Databases | Established research databases and market intelligence resources | Market benchmarking, historical data, and industry analysis |
Research Workflow & Quality Assurance
Data Collection
Verified information gathered through primary and secondary research.
Data Triangulation
Cross-validation using multiple independent data sources.
Forecast Modelling
Market estimates developed using historical trends and analytical models.
Analyst Validation
Findings reviewed by domain experts for accuracy and consistency.
Editorial & Quality Review
Final editorial, quality, and compliance checks before publication.
Final Publication
Released after successful completion of the internal review process.
Report Coverage
📊 Market Assessment
- Market Size & Forecast
- Market Segmentation
- Regional Analysis
- Growth Drivers & Challenges
- Market Dynamics
🏢 Competitive Intelligence
- Competitive Landscape
- Company Profiles
- Competitive Benchmarking
- Mergers & Acquisitions
- Market Share Analysis or Key Company Strategies
🔍 Strategic Analysis
- Value Chain Analysis
- Porter's Five Forces
- PESTLE Analysis
- Pricing Trends
- Supply-Demand Analysis
🚀 Future Outlook
- Technology Landscape
- Regulatory Landscape
- Investment & Funding Landscape
- Emerging Opportunities
- Future Market Outlook
Have a question about this report or need a custom scope?
Request Customization