Reduced Fat Butter Market Size & Growth Forecast 2026–2035, By Segments (Distribution Channel), Regional Demand Trends (North America, Asia Pacific, Europe), Key Country Insights (U.S., Japan, South Korea, Germany, France, Italy), and Competitive Landscape
Market Size and Growoth Outlook
Reduced Fat Butter Market size was worth USD 1.15 Billion in 2025 and is poised to grow at a 4.4% CAGR between 2026 and 2035, exceeding USD 1.77 Billion by 2035. The industry revenue for 2026 is assessed at USD 1.19 billion.
Get more details on this report
Request Free Sample ReportReduced Fat Butter Market Intelligence Snapshot
Regional Market Dynamics
- Europe captured 32.65% of the market in 2025, supported by a strong dairy processing base, broad retail availability, and consumer familiarity with reduced-fat butter alternatives.
- Asia Pacific is expected to grow at a 5.02% CAGR as changing diets, expanding retail channels, and rising consumption of bakery and breakfast products increase demand.
Segment Momentum
- Stores dominate with a 78.38% share in 2025 due to routine grocery purchasing, chilled product availability, strong shelf visibility, and immediate access during regular supermarket and hypermarket visits.
- Online is the fastest-growing channel as consumers shift to app-based grocery ordering, valuing home delivery convenience, broader assortment access, and efficient replenishment of everyday refrigerated essentials.
Market Expansion Drivers
- Rising obesity and lifestyle diseases driving shift toward low-fat dairy consumption.
- Product innovation in flavored and fortified reduced-fat butter variants expanding demand.
- Expansion of modern retail and e-commerce improving accessibility of healthier dairy alternatives.
Leading Market Participants
Global Market Forecast Snapshot
Market Outlook
Key companies in the reduced fat butter market include Land O'Lakes, Inc. (United States), Fonterra Co-operative Group Limited (New Zealand), Ornua Co-operative Limited (Ireland), Gujarat Co-operative Milk Marketing Federation Ltd. (India), Saputo Dairy Australia Pty Ltd (Australia), Finlandia Cheese, Inc. (United States), Palsgaard A/S (Denmark), Agral S.A. (Portugal), Arla Foods amba (Denmark), Lactalis Group (France).Regional and Segment Outlook
EuropeMarket Growth Drivers and Industry Trends
Growing concern over obesity, cardiovascular conditions, and diet-related metabolic disorders is reshaping everyday dairy purchasing, with consumers paying closer attention to fat content in staple products rather than treating healthier choices as occasional substitutes. In the reduced fat butter market, this is driving demand from households seeking to moderate calorie and saturated fat intake without fully giving up butter’s taste and cooking functionality. The shift is also influencing retailer assortment and brand positioning, as reduced-fat options gain more shelf space in response to repeat demand from health-conscious buyers, weight-management consumers, and families adjusting routine food choices toward lower-fat dairy products.
Product innovation in flavored and fortified reduced-fat butter variants expanding demand
Innovation is widening the use case for reduced-fat butter beyond a basic health substitute by making the product more appealing in taste, convenience, and perceived nutritional value. In the reduced fat butter market, flavored variants help brands attract consumers who want differentiation for spreads, breakfast use, and light cooking, while fortified formulations support premium positioning tied to added nutritional benefits. This expands buyer interest beyond traditional calorie-conscious users and encourages trial among consumers who may otherwise view reduced-fat butter as a compromise, driving market development through better product relevance and broader shelf appeal.
Expansion of modern retail and e-commerce improving accessibility of healthier dairy alternatives
Wider distribution through supermarkets, hypermarkets, specialty food chains, and online grocery platforms is making reduced-fat butter easier to find, compare, and purchase as part of routine shopping. For the reduced fat butter market, this matters because healthier dairy alternatives often depend on visibility and convenience to convert interest into repeat buying, especially when consumers are evaluating fat content, ingredients, and brand claims at the point of purchase. E-commerce and modern retail formats also support market penetration by enabling broader geographic reach, more targeted promotions, and stronger product discovery, helping reduced-fat butter move from niche placement into mainstream dairy consumption patterns.
| Growth Driver | Impact on CAGR | Regulatory Influence | Geographic Relevance | Adoption Rate | Impact Timeline |
|---|---|---|---|---|---|
| Rising obesity and lifestyle diseases driving shift toward low-fat dairy consumption | 2.30% | Moderate | North America, Europe | High | Near Term |
| Product innovation in flavored and fortified reduced-fat butter variants expanding demand | 2.10% | Low | Europe, North America | Medium | Mid Term |
| Expansion of modern retail and e-commerce improving accessibility of healthier dairy alternatives | 2.00% | Low | Europe, Asia Pacific | High | Mid Term |
Unlock insights tailored to your business with our bespoke market research solutions.
Click to get your customized report now.
Regional Demand Dynamics
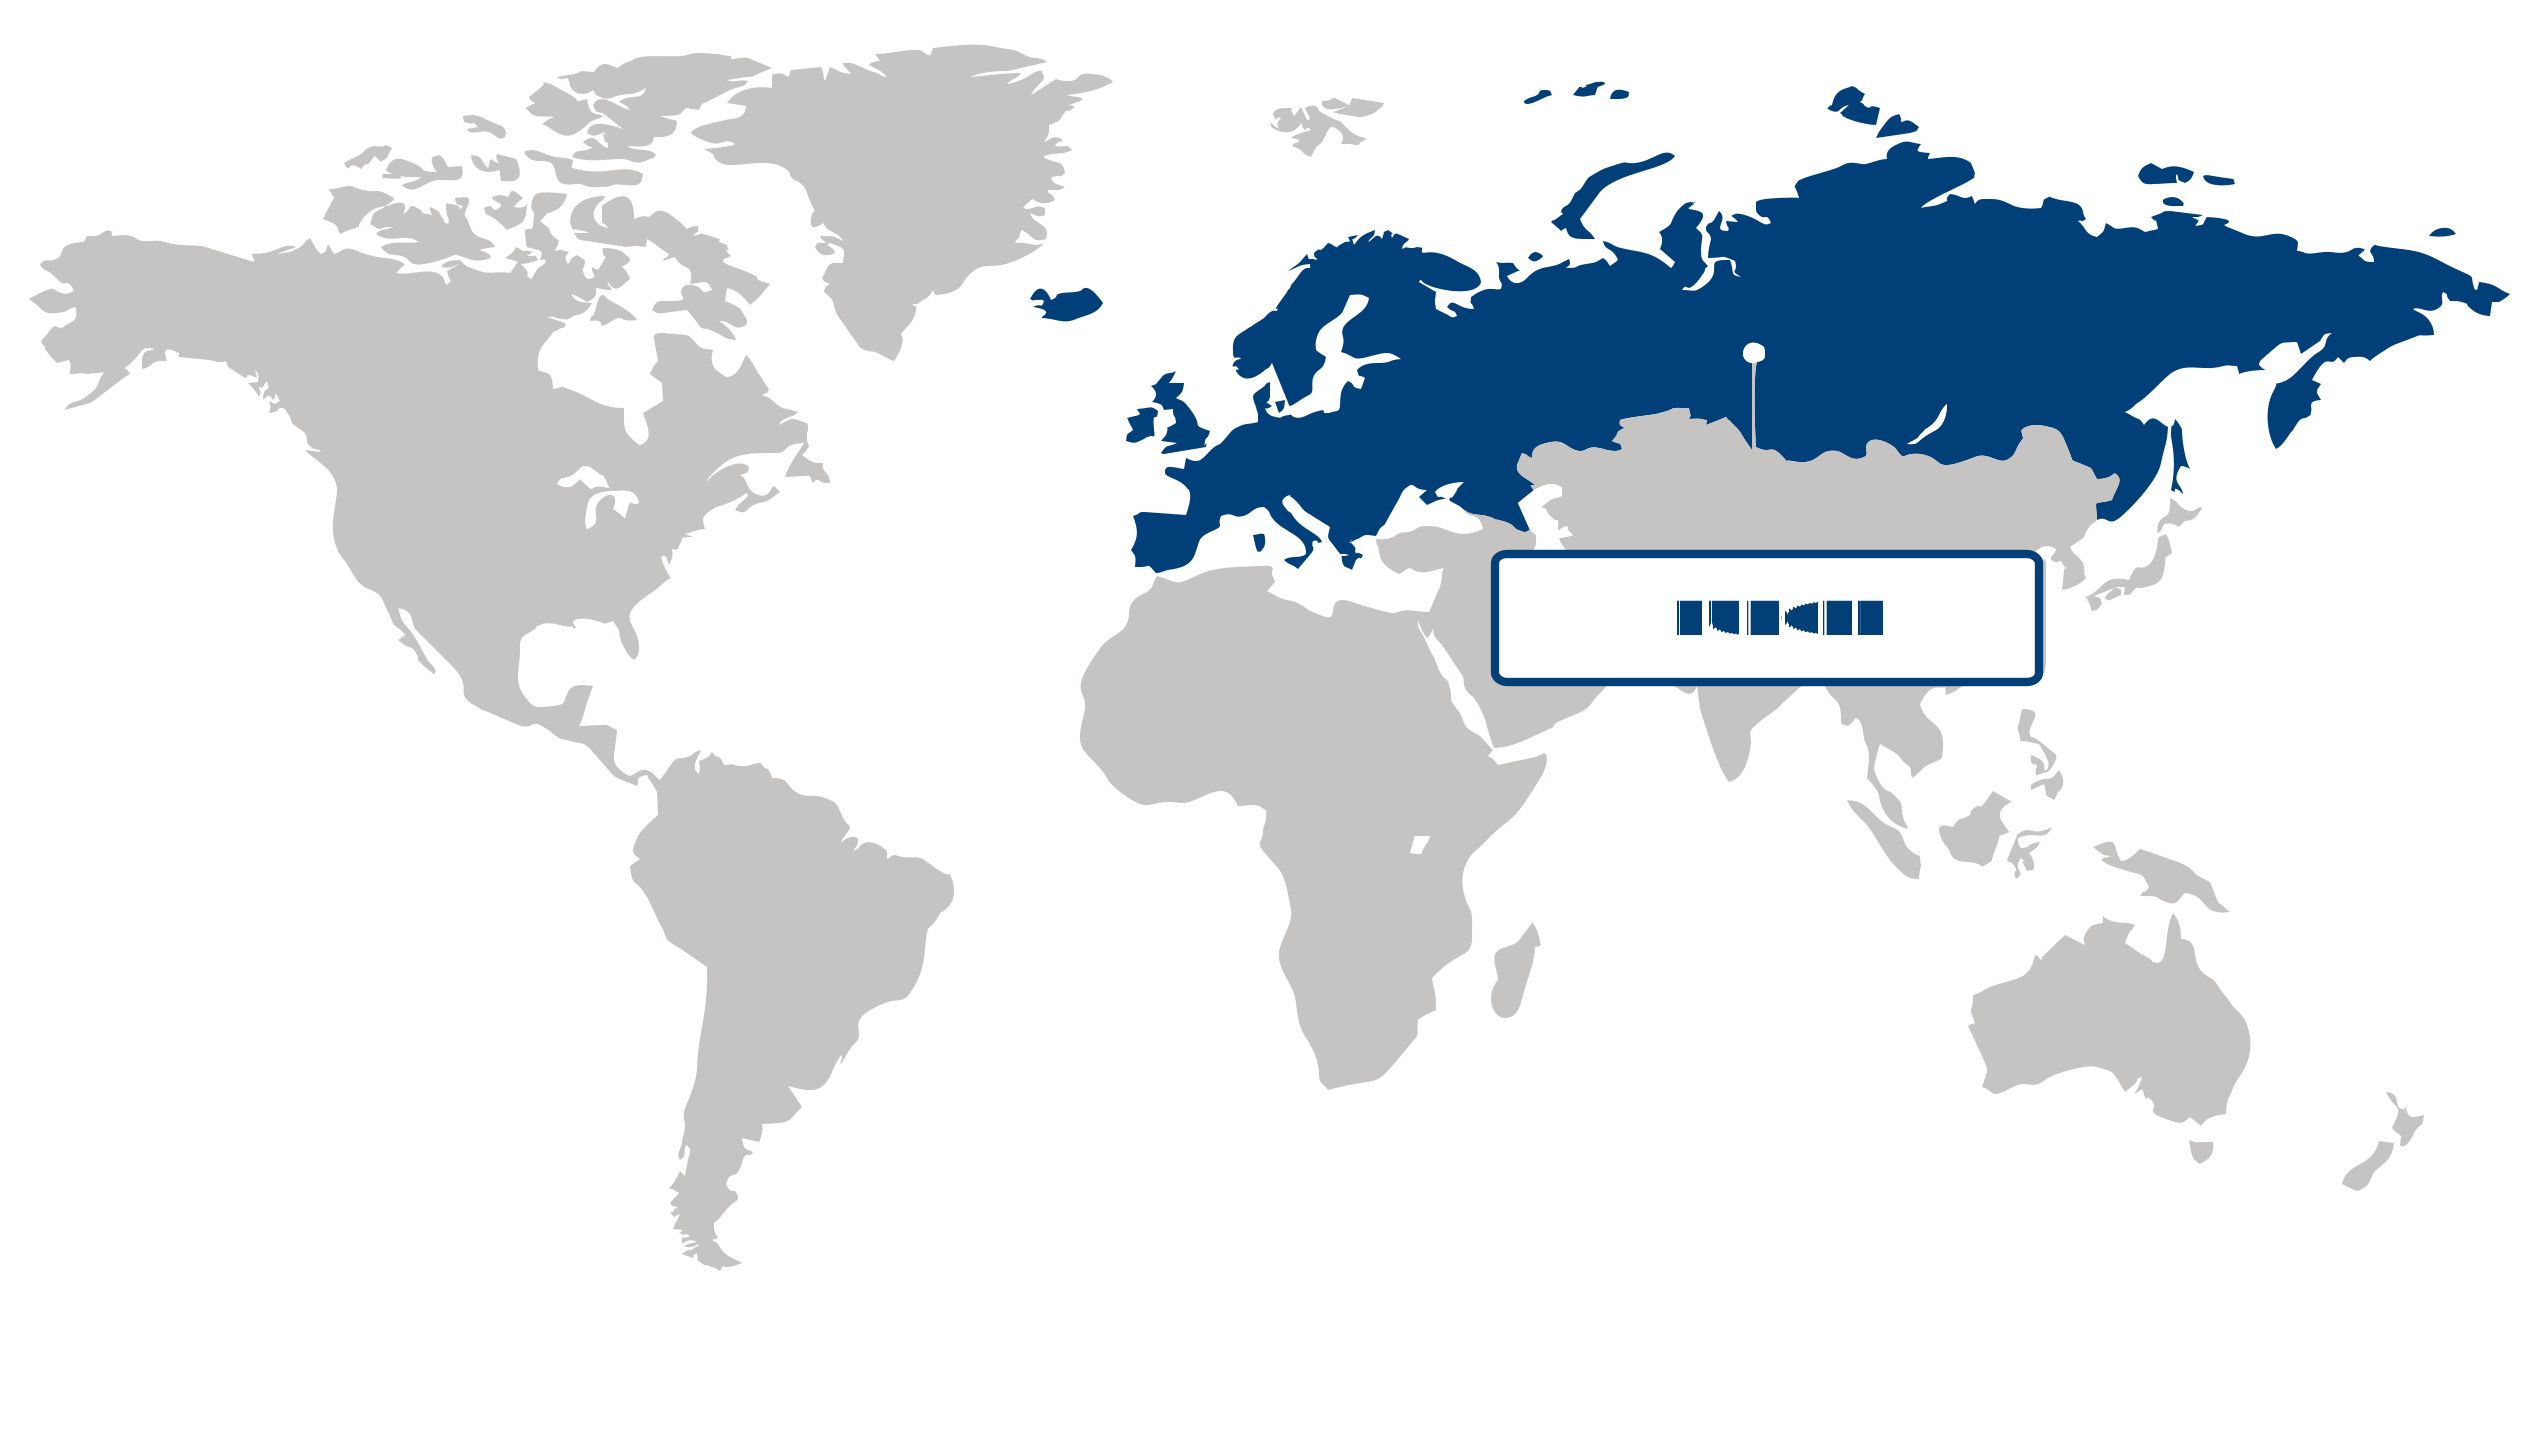
Europe held a 32.65% share of the reduced fat butter market in 2025, supported by the region’s well-established dairy processing base, broad retail penetration, and strong consumer familiarity with butter as a staple household product. Demand is reinforced by mature product availability across supermarkets and private-label channels, where reduced-fat variants are positioned as everyday alternatives rather than niche offerings. The region’s leadership is also supported by manufacturers’ ability to align traditional butter consumption habits with demand for lighter formulations, keeping volumes steady across both household and foodservice use.
Asia Pacific is projected to expand at a 5.02% CAGR over the forecast period, with the reduced fat butter market gaining momentum as changing diets, urban retail expansion, and rising exposure to packaged dairy products reshape consumption patterns. Growth is being fueled by increasing uptake of western-style bakery and breakfast products, which is widening the use of butter-based ingredients in both home and commercial settings. As organized retail and modern grocery formats improve product visibility and access, reduced-fat options are becoming more practical for consumers seeking dairy products that better fit evolving dietary preferences.
| Parameter | North America | Asia Pacific | Europe | Latin America | MEA |
|---|---|---|---|---|---|
| Innovation Hub i Scale Nascent Developing Advanced | |||||
| Cost-Sensitive Region i Scale Low Medium High | |||||
| Regulatory Environment i Scale Restrictive Neutral Supportive | |||||
| Demand Drivers i Scale Weak Moderate Strong | |||||
| Development Stage i Scale Emerging Developing Developed | |||||
| Adoption Rate i Scale Low Medium High | |||||
| New Entrants / Startups i Scale Sparse Moderate Dense | |||||
| Macro Indicators i Scale Weak Stable Strong |
Key Country Insights
Germany 🇩🇪
Functional Dairy PreferencesGermany encourages reduced fat butter products that combine authentic dairy quality with nutritional improvements. Manufacturers focus on ingredient transparency, natural production methods, and product consistency to satisfy consumers seeking healthier everyday dairy options.
France 🇫🇷
Culinary Quality BalanceFrance values reduced fat butter that maintains traditional culinary performance while offering lower-fat alternatives. Companies operating in France prioritize product quality, authentic taste, and premium positioning to meet evolving consumer preferences without compromising cooking applications.
Italy 🇮🇹
Everyday Wellness AppealItaly is witnessing broader interest in reduced fat butter among consumers seeking healthier versions of familiar dairy products. Manufacturers focus on preserving flavor and versatility while strengthening retail offerings suited to daily household consumption.
Japan 🇯🇵
Portion-Control InnovationJapan emphasizes reduced fat butter products in convenient portion sizes that suit smaller households and practical meal preparation. Manufacturers continue refining texture and taste while responding to consumer expectations for balanced nutrition and premium food quality.
South Korea 🇰🇷
Convenience Retail ExpansionSouth Korea supports reduced fat butter adoption through modern retail formats and growing interest in healthier cooking ingredients. Producers are expanding product visibility with compact packaging and formulations that appeal to consumers seeking lighter dairy alternatives.
United States 🇺🇸
Health-Oriented Dairy ChoicesThe U.S. reduced fat butter market reflects consumer interest in balancing traditional butter flavor with healthier dietary preferences. Producers are introducing improved formulations and convenient packaging while expanding distribution across supermarkets and online grocery platforms.
Segment Leadership and Growth Trends
Reduced Fat Butter Market Share (%), Distribution Channel, 2025
Go beyond the chart, access full insights & data tables
Request Free Sample ReportStores held the strongest position in the reduced fat butter market in 2025, accounting for a 78.38% share. This channel maintains its leadership because reduced fat butter is a routine grocery purchase that consumers often make during regular supermarket and hypermarket visits, where chilled storage, immediate product availability, and side-by-side brand comparison support purchase decisions. Physical retail also benefits from established dairy supply chains and strong shelf visibility, which help sustain high transaction volumes in the reduced fat butter market.
Online is emerging as the fastest-growing distribution channel in the reduced fat butter market as consumers increasingly shift everyday food purchasing toward digital grocery platforms. Its momentum is being backed by the convenience of home delivery, easier access to broader product assortments, and the growing use of app-based ordering for repeat household staples. Compared with stores, online channels are gaining traction because they fit changing shopping habits more closely, especially among time-conscious consumers seeking efficient replenishment of refrigerated grocery items.
| Segment | Sub-Segment | Largest Segment | Fastest Growing |
|---|---|---|---|
| Distribution Channel | Stores, Online | Stores | Online |
Competitive Landscape and Market Positioning
1. Land O'Lakes Inc. (United States)
2. Fonterra Co-operative Group Limited (New Zealand)
3. Ornua Co-operative Limited (Ireland)
4. Gujarat Co-operative Milk Marketing Federation Ltd. (India)
5. Saputo Dairy Australia Pty Ltd (Australia)
6. Finlandia Cheese Inc. (United States)
7. Palsgaard A/S (Denmark)
8. Agral S.A. (Portugal)
9. Arla Foods amba (Denmark)
10. Lactalis Group (France)
The reduced fat butter market is experiencing growth as consumers increasingly seek healthier dairy alternatives with balanced taste and nutritional value. Manufacturers are refining formulations to improve texture, flavor retention, and reduced-calorie content while maintaining product quality. Expansion of functional dairy offerings and demand for heart-conscious food products are also shaping competitive strategies in the market.
| Company | Market Share | Company Revenue | Revenue CAGR (%) | Product Portfolio | Geographic Presence | Innovation / R&D Focus | Strategic Developments |
|---|---|---|---|---|---|---|---|
| No companies available. | |||||||
Industry Development/News
| Company Name | Date | Key Development |
|---|
Explore This Report
Click a section of the wheel — or its numbered marker — to preview the custom segmentation, custom table of contents, or related reports available for this market.
Reduced Fat Butter Market — Custom Segments
| Segment | Sub-Segment |
|---|---|
| No segment data available. | |
Reduced Fat Butter Market — report.custom
| Custom Chapter | Custom Details | ||
|---|---|---|---|
| No custom TOC data available. | |||
Need a different cut of the data?
Request Custom ResearchHow much revenue does the reduced fat butter market generate?
How much is the reduced fat butter industry expected to grow by 2035?
How is rising health awareness influencing consumer purchasing and retail positioning in the reduced fat butter market?
How are product innovation and distribution expansion shaping market adoption in the reduced fat butter market?
Why do Stores remain the leading channel for reduced fat butter?
How is Online changing reduced fat butter purchasing behavior?
Why does Europe hold the largest share of the reduced fat butter market?
Which region is driving future growth in the reduced fat butter market?
What are the prominent companies operating in the reduced fat butter landscape?
Our Clients
"The reports offered a comprehensive view of the Food and Beverage landscape, covering market trends, consumer behavior, and competitive dynamics."
"Our experience in acquiring market research reports has been outstanding — the depth of analysis and actionable insights have proven invaluable."
"Fundamental Business Insights demonstrated a keen understanding of our business needs, delivering reports tailored to our specific objectives."
Our Research Team & Methodology
Every Fundamental Business Insights report is built by a dedicated vertical research team, validated through a structured primary-and-secondary methodology, and reviewed for accuracy before it reaches you.
Research Team Overview
Prepared by the Food & Beverage Research Team
Delivery
Published
Demand
Available
Support
Trust & Compliance
Research Domains
10 coverage areasResearch Intelligence
| Source Category | Research Sources | Purpose |
|---|---|---|
| Government Publications | Government agencies, statistical departments, regulatory bodies | Industry statistics, regulatory insights, and policy analysis |
| Company Disclosures | Annual reports, investor presentations, financial filings | Company performance, business strategy, and market positioning |
| Trade Associations | Industry associations and professional organizations | Industry developments, standards, and market perspectives |
| Technical Literature | Research papers, technical publications, academic journals | Technology developments and technical validation |
| Patent Analysis | Patent databases and intellectual property publications | Innovation trends, technology activity, and competitive research |
| Industry Databases | Established research databases and market intelligence resources | Market benchmarking, historical data, and industry analysis |
Research Workflow & Quality Assurance
Data Collection
Verified information gathered through primary and secondary research.
Data Triangulation
Cross-validation using multiple independent data sources.
Forecast Modelling
Market estimates developed using historical trends and analytical models.
Analyst Validation
Findings reviewed by domain experts for accuracy and consistency.
Editorial & Quality Review
Final editorial, quality, and compliance checks before publication.
Final Publication
Released after successful completion of the internal review process.
Report Coverage
📊 Market Assessment
- Market Size & Forecast
- Market Segmentation
- Regional Analysis
- Growth Drivers & Challenges
- Market Dynamics
🏢 Competitive Intelligence
- Competitive Landscape
- Company Profiles
- Competitive Benchmarking
- Mergers & Acquisitions
- Market Share Analysis or Key Company Strategies
🔍 Strategic Analysis
- Value Chain Analysis
- Porter's Five Forces
- PESTLE Analysis
- Pricing Trends
- Supply-Demand Analysis
🚀 Future Outlook
- Technology Landscape
- Regulatory Landscape
- Investment & Funding Landscape
- Emerging Opportunities
- Future Market Outlook
Have a question about this report or need a custom scope?
Request Customization