Solar PV Supply Chain Market Size & Forecasts 2026-2035, By Segments (Application, Type), Growth Opportunities, Innovation Landscape, Regulatory Shifts, Strategic Regional Insights (U.S., Japan, China, South Korea, UK, Germany, France), and Competitive Dynamics (LONGi, JinkoSolar, Trina Solar, Canadian Solar, JA Solar)
Market Size and Growoth Outlook
Solar PV Supply Chain Market size is forecasted to reach USD 573.11 billion by 2035, rising from USD 173.38 billion in 2025, at a CAGR of more than 12.7% between 2026 and 2035. In 2026, revenue is projected at USD 193.04 billion.
Get more details on this report
Request Free Sample ReportSolar PV Supply Chain Market Intelligence Snapshot
Regional Market Dynamics
Segment Momentum
Market Expansion Drivers
Leading Market Participants
Global Market Forecast Snapshot
Market Outlook
Regional and Segment Outlook
Market Growth Drivers and Industry Trends
The accelerating global adoption of solar photovoltaic systems is a fundamental driver reshaping the solar PV supply chain market. Increasing consumer and commercial demand for clean energy, supported by expanding capacity installations in key markets such as China and the United States, intensifies the need for efficient supply networks. For example, the International Renewable Energy Agency (IRENA) highlights rapid capacity additions in emerging economies, prompting supply chain actors to optimize sourcing and logistics. This trend provides strategic openings for manufacturers and integrators to scale operations, enhance delivery speed, and innovate in module technology. Companies that streamline production and distribution to match installation surges are positioned to outperform competitors. Ongoing infrastructure buildup ensures that supply chain resilience and scalability remain central, driven by observable expansion plans in multi-region solar deployments.
Strengthening of PV Supply Chain & Manufacturing
The fortification of manufacturing capabilities and supply chain robustness is significantly influencing market dynamics within the solar PV supply chain market. Industry leaders, exemplified by Trina Solar’s recent investments in advanced high-efficiency module production, are innovating to reduce dependency on constrained raw materials and address geopolitical trade challenges. These developments reflect broader economic shifts toward localized and integrated manufacturing ecosystems that improve risk management and supply reliability. Both incumbents and newcomers can leverage enhanced production capacities and proximal supply hubs to reduce lead times and costs. The visible acceleration in vertical integration, alongside automation implementation in factories, underscores a transformative phase where streamlined supply chains offer clear competitive advantages and operational resilience.
Long-Term Policies for Renewable Energy Expansion
Sustained policy commitments to renewable energy targets are a key driver reinforcing the solar PV supply chain market’s growth trajectory. Governments worldwide, such as the European Union under its Green Deal framework, have enacted long-term incentives and regulatory mandates that encourage solar adoption and domestic manufacturing. These policies create a stable demand environment for suppliers and manufacturers while fostering innovation through subsidized research and infrastructure programs. Established firms gain from predictable market conditions facilitating strategic investment, while new entrants find fertile ground for disruptive business models aligned with evolving standards. The solidifying policy landscape signals ongoing support for supply chain expansion and technological advancement, ensuring durable opportunities grounded in regulatory certainty rather than transient incentives.
Industry Restraints:
Raw Material Price Volatility
The solar PV supply chain faces significant constraints due to the volatility in prices of critical raw materials such as polysilicon, silver, and aluminum. These fluctuations stem from geopolitical tensions and trade restrictions, which disrupt procurement and increase operational costs for manufacturers. For instance, the International Energy Agency (IEA) highlighted how recent semiconductor trade disputes and mining restrictions in key producing countries have exacerbated material scarcity and price spikes. This unpredictability hampers procurement planning and squeezes margins, disproportionately affecting smaller, emerging manufacturers with limited hedging capacity. To navigate these challenges, companies must enhance supply chain agility and diversify sourcing strategies. Until geopolitical and trade uncertainties stabilize, raw material price volatility will remain a pivotal challenge, constraining investment decisions and slowing supply chain scaling efforts.
Regulatory and Trade Policy Barriers
Stringent regulatory frameworks and inconsistent trade policies impose substantial friction on the solar PV supply chain’s expansion. Complex import tariffs, local content requirements, and differing certification standards—exemplified by the U.S. Department of Commerce’s anti-dumping duties on solar imports—disrupt cross-border logistics and increase compliance costs. Such regulatory burdens elongate lead times and reduce overall supply chain responsiveness, limiting market accessibility for new entrants and complicating operational scale-up for incumbents. The Solar Energy Industries Association (SEIA) warns that these policy-induced inefficiencies risk slowing down global solar deployment targets. Moving forward, unless international cooperation improves and policies harmonize, regulatory constraints will continue to fragment the supply chain, compelling market participants to invest heavily in compliance and risk management rather than innovation and capacity expansion.
| Growth Driver | Impact on CAGR | Regulatory Influence | Geographic Relevance | Adoption Rate | Impact Timeline |
|---|---|---|---|---|---|
| Growth in Solar PV Installations & Capacity Expansion | 5.00% | Short term (≤ 2 yrs) | North America, Europe | Medium | Fast |
| Strengthening of PV Supply Chain & Manufacturing | 4.00% | Medium term (2–5 yrs) | Asia Pacific, Europe | Low | Moderate |
| Long-Term Policies for Renewable Energy Expansion | 3.70% | Long term (5+ yrs) | Europe, North America | High | Moderate |
Unlock insights tailored to your business with our bespoke market research solutions.
Click to get your customized report now.
Regional Demand Dynamics
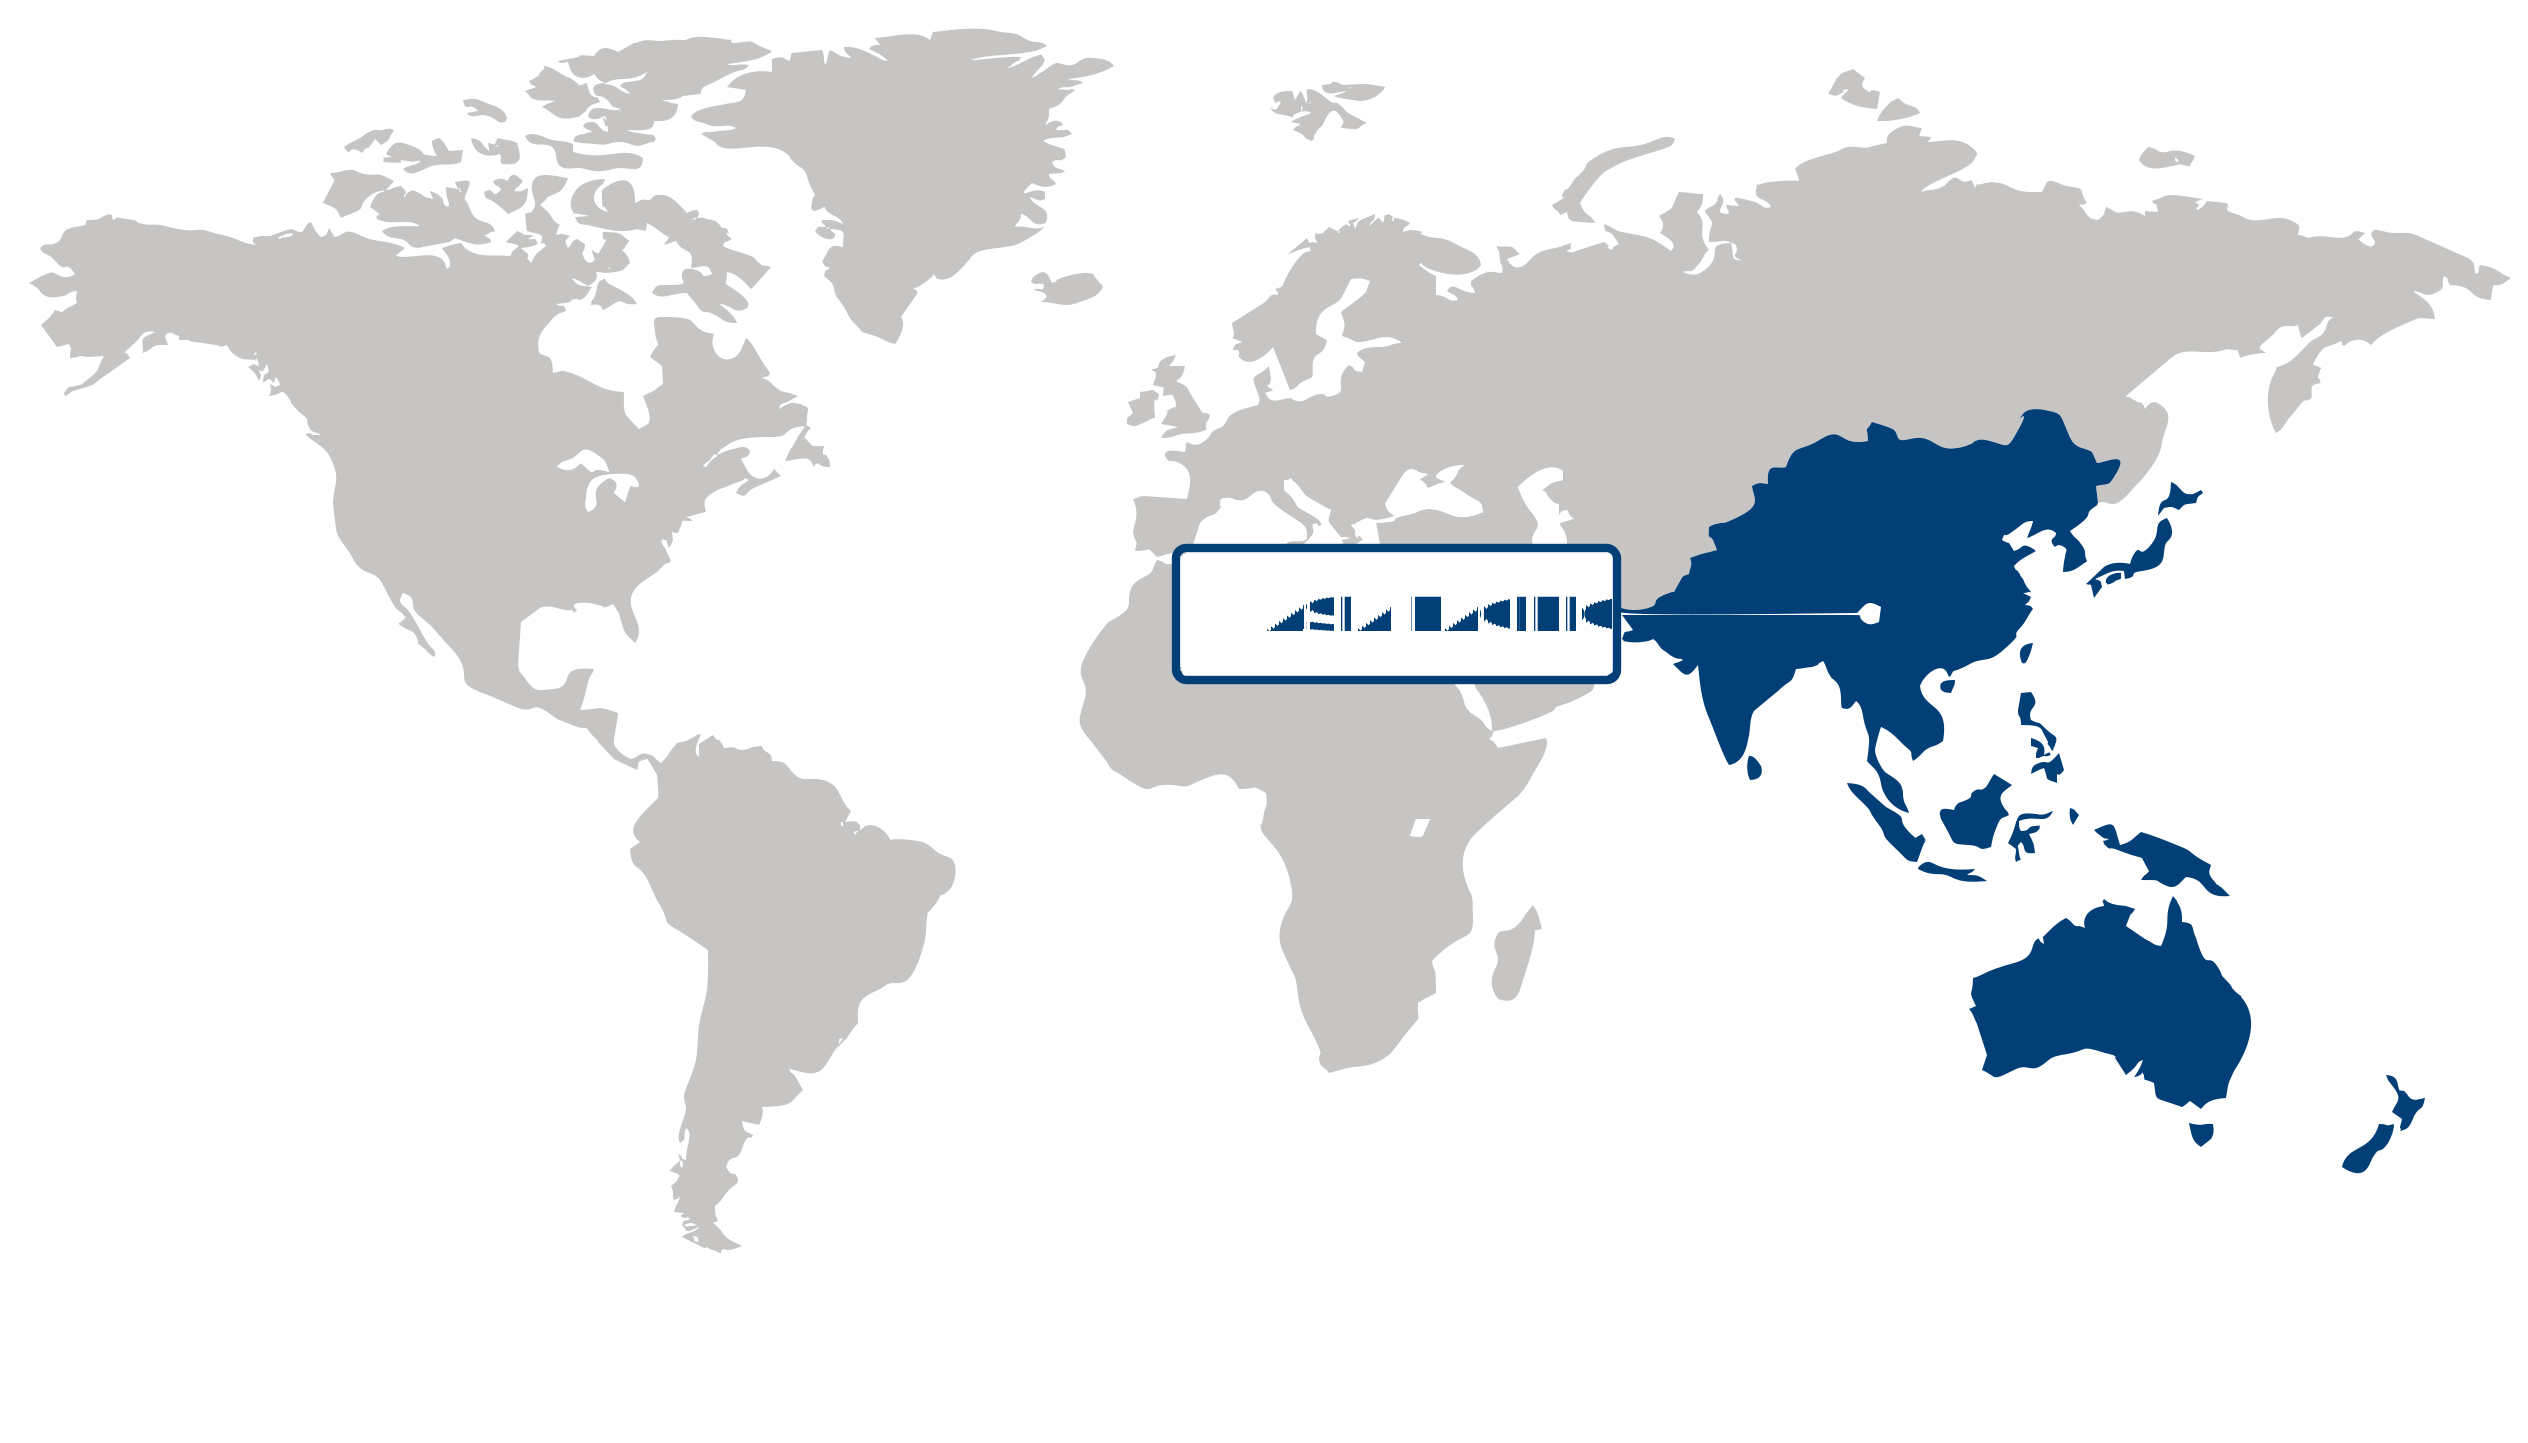
Asia Pacific dominated the solar PV supply chain market in 2025, capturing over 50% of the global share and exhibiting the fastest growth with a 15.24% CAGR. The region’s leadership stems from its dominant manufacturing capacity, particularly in semiconductor and solar panel production hubs, combined with robust policy support incentivizing renewable energy adoption. Countries such as China and Japan have aggressively pursued sustainability agendas through government-backed subsidies, streamlined permitting processes, and significant investments in advanced module technologies. According to the International Renewable Energy Agency (IRENA), Asia Pacific’s commitment to decarbonization and energy transition underpins rising demand, further accelerating capacity expansions and enhancing supply chain efficiencies. This convergence of demand dynamics and strategic industrial policies positions the region with substantial opportunities for continued innovation and scale, solidifying Asia Pacific as an essential global nexus in the solar PV supply chain market.
China anchors the Asia Pacific solar PV supply chain market with its unparalleled manufacturing infrastructure and strategic policy frameworks. The Chinese government’s 14th Five-Year Plan explicitly prioritizes solar energy expansion, fostering domestic production of polysilicon, wafers, and modules with leading firms like LONGi Green Energy spearheading technological advancements and scaling. This strong industrial base is complemented by a sophisticated logistics network that supports export competitiveness, enabling China to meet growing global and regional demand efficiently. This depth of integration not only sustains China’s role as a supply chain powerhouse but also amplifies opportunities for regional value chain cooperation and innovation.
Japan plays a pivotal role in the Asia Pacific solar PV supply chain market as a technology innovator and policy-driven adopter. The nation’s strategic focus on high-efficiency photovoltaic cells and smart grid integration is backed by government bodies such as the Ministry of Economy, Trade and Industry (METI), which promotes R&D and flexible deployment models in urban and industrial settings. Japanese companies like Panasonic and Sharp leverage these initiatives to push forward quality standards and operational excellence, reflecting a mature market with growing consumer and commercial uptake. Japan’s advanced technological contributions and market sophistication complement regional supply chain strengths, reinforcing Asia Pacific’s position as a leader in solar PV innovation and sustainable development.
Europe Market Analysis:
Europe held a commanding share in the solar PV supply chain market, driven by the region's strong commitment to renewable energy targets and robust regulatory frameworks supporting clean energy adoption. The European Union’s Green Deal and Fit for 55 package promote substantial investments in solar infrastructure and local manufacturing capacities, fostering innovation in module efficiency, smart grid integration, and recycling technologies. This regulatory momentum aligns with shifting consumer preferences toward sustainable energy solutions and catalyzes increased spending by both public and private sectors. Additionally, established logistics networks and skilled labor pools across the continent enhance operational efficiency and supply chain resilience. For instance, the European Solar Manufacturing Council has been pivotal in coordinating cross-border industry advancements. Europe’s steady growth is poised to continue as it increasingly integrates digital transformation and circular economy principles, offering investors significant opportunities in the evolving solar PV supply chain market.
Germany remains a cornerstone of Europe’s solar PV supply chain market, underpinned by its rigorous energy transition policies and leading technology innovation. The country’s Energiewende initiative exemplifies a national shift towards de-carbonization, stimulating demand for high-quality photovoltaic components and advanced system solutions. Germany’s strong industrial base, supported by the Fraunhofer Institute for Solar Energy Systems, bolsters research in cell efficiency and manufacturing automation. Consumer demand is further amplified by incentives such as feed-in tariffs and subsidies that encourage rooftop solar installations across residential and commercial sectors. These dynamics make Germany a critical hub for scaling solar PV technologies and supply chain optimization, reinforcing Europe’s strategic role in clean energy advancement.
France plays a pivotal role in Europe’s solar PV supply chain market with its growing focus on solar capacity expansion and sustainable energy investments. The country’s Multiannual Energy Plan promotes increased domestic manufacturing of solar modules and balance-of-system components, enhancing supply chain security amid global disruptions. French consumer markets show rising adoption driven by competitive pricing and government-led rebate programs, while firms like TotalEnergies have expanded their solar portfolios, signaling escalating corporate participation. Additionally, France’s integration of solar energy in smart city projects reflects evolving urban sustainability priorities. This combination of policy support and market dynamics positions France to complement Germany’s leadership, strengthening Europe’s overall capability and competitiveness in the solar PV supply chain market.
North America Market Trends:
North America has maintained a notable presence in the solar PV supply chain market, driven by its robust innovation ecosystem and evolving policy landscape. The region benefits from increasing investment in clean energy infrastructure and shifting consumer sentiment favoring sustainability, reinforced by targeted government incentives and streamlined permitting processes. Recent acceleration in digitalization and automation within manufacturing and logistics, highlighted by First Solar’s expansion of its advanced module production lines, underscores North America’s operational sophistication. Additionally, heightened competition among technology providers is fostering efficiency and cost reductions, while workforce upskilling initiatives supported by the U.S. Department of Energy enhance regional capabilities. These cumulative dynamics position North America, particularly given its steady growth trajectory, as a key hub for scalable solar PV supply chain development amid ongoing prioritization of domestic resilience and decarbonization targets.
The U.S. plays a central role within North America’s solar PV supply chain market, primarily driven by expansive federal and state-level policy frameworks promoting renewable deployment. The Inflation Reduction Act’s provisions have notably boosted demand for locally manufactured solar components, catalyzing supply chain localization efforts. This is evidenced by Qcells’ announcement of new manufacturing facilities aimed at reducing import dependency while meeting rising domestic consumption. Concurrently, robust financial incentives have stimulated innovation in module efficiency and recycling technologies, supported by collaborations between the National Renewable Energy Laboratory and industry partners. These factors reinforce the U.S. as a strategic linchpin, enabling broader regional industry growth by enhancing supply chain resilience and fostering competitive positioning in solar PV markets.
| Parameter | North America | Asia Pacific | Europe | Latin America | MEA |
|---|---|---|---|---|---|
| Innovation Hub i Scale Nascent Developing Advanced | |||||
| Cost-Sensitive Region i Scale Low Medium High | |||||
| Regulatory Environment i Scale Restrictive Neutral Supportive | |||||
| Demand Drivers i Scale Weak Moderate Strong | |||||
| Development Stage i Scale Emerging Developing Developed | |||||
| Adoption Rate i Scale Low Medium High | |||||
| New Entrants / Startups i Scale Sparse Moderate Dense | |||||
| Macro Indicators i Scale Weak Stable Strong |
Segment Leadership and Growth Trends
Solar PV Supply Chain Market Share (%), Application, 2025
Go beyond the chart, access full insights & data tables
Request Free Sample ReportUtility scale represented largest share in the solar PV supply chain market in 2025, driven by declining levelized cost of electricity alongside strong policy frameworks favoring extensive solar capacity additions. This segment benefits from increased investor confidence and regulatory milestones such as auction-based tendering systems championed by the International Renewable Energy Agency (IRENA). Demand patterns indicate a shift towards large-scale installations that offer economies of scale and grid integration advantages. Established energy producers and new market entrants alike gain strategic leverage through utility-scale projects facilitating accelerated digital monitoring and predictive maintenance. The segment’s substantial capital deployment and sustainability impact position it as a critical component in national decarbonization agendas, ensuring sustained relevance amid evolving energy transition priorities and infrastructure expansions over the coming years.
Analysis by Type
Solar module held largest share in the solar PV supply chain market in 2025, propelled by surging global demand amplified by cost reductions and robust renewable energy targets endorsed by governments worldwide. Technological advancements in module efficiency and manufacturing automation, highlighted in recent press releases from LONGi Green Energy, underscore the segment’s leadership. Customer preferences favor high-performance, durable modules that align with sustainability goals and incentivized green procurement policies. This segment’s dynamic competitive landscape drives innovation while supply chain enhancements, including diversified supplier networks, mitigate bottlenecks. For both incumbents and new entrants, solar modules offer significant market penetration opportunities due to expanding distributed and centralized solar capacity. The segment is poised to maintain its dominance as modular innovations and policy-driven demand continue fueling deployment across diverse geographies and applications.
| Segment | Sub-Segment | Largest Segment | Fastest Growing |
|---|---|---|---|
| Application | Utility Scale, C&I, Residential | ||
| Type | Solar Polysilicon, Ingot & Wafer, Solar Cell, Solar Module |
Competitive Landscape and Market Positioning
The competitive environment is marked by intensified efforts to enhance technological leadership and supply chain resilience. Top players frequently engage in strategic partnerships and acquisitions that broaden product portfolios and regional footprints. Investments in novel high-efficiency solar cells and automation bolster production capabilities, while alliances with material suppliers and tech firms accelerate R&D outcomes. This collaborative momentum, combined with ongoing product diversification, strengthens competitive positioning amid supply constraints and evolving demand profiles, underscoring innovation-driven differentiation across the market.
Strategic / Actionable Recommendations for Regional Players
In North America, fostering partnerships with technology firms specializing in advanced materials and energy storage can augment value chain integration. Emphasizing innovation in sustainable production methods and targeting niche segments like building-integrated photovoltaics may further solidify market relevance amid growing environmental regulations.
Asia Pacific players should intensify collaborations within regional clusters to optimize raw material sourcing and manufacturing efficiencies. Leveraging breakthroughs in bifacial and perovskite solar cells can enhance product offerings, capturing high-growth applications in residential and utility-scale projects.
European companies could focus on strengthening ties with policy-driven green energy initiatives and scaling up circular economy practices. Integrating digital solutions for supply chain transparency and expanding into emerging solar sub-segments will help maintain competitiveness within a tightly regulated yet innovation-centric environment.
| Company | Market Share | Company Revenue | Revenue CAGR (%) | Product Portfolio | Geographic Presence | Innovation / R&D Focus | Strategic Developments |
|---|---|---|---|---|---|---|---|
| No companies available. | |||||||
Industry Development/News
| Company Name | Date | Key Development |
|---|
Explore This Report
Click a section of the wheel — or its numbered marker — to preview the custom segmentation, custom table of contents, or related reports available for this market.
Solar PV Supply Chain Market — Custom Segments
| Segment | Sub-Segment |
|---|---|
| No segment data available. | |
Solar PV Supply Chain Market — report.custom
| Custom Chapter | Custom Details | ||
|---|---|---|---|
| No custom TOC data available. | |||
Need a different cut of the data?
Request Custom ResearchHow is the solar PV supply chain industry size expected to evolve during the forecast period?
Which part of the world represents the largest segment of the solar PV supply chain market?
Who is driving the fastest regional growth in the solar PV supply chain sector?
Why does utility scale sub-segment dominate the application segment of solar PV supply chain sector?
How much is the solar module segment expected to grow in the solar PV supply chain industry beyond 2025?
Which companies dominate the solar PV supply chain landscape?
Our Clients
"The reports offered a comprehensive view of the Food and Beverage landscape, covering market trends, consumer behavior, and competitive dynamics."
"Our experience in acquiring market research reports has been outstanding — the depth of analysis and actionable insights have proven invaluable."
"Fundamental Business Insights demonstrated a keen understanding of our business needs, delivering reports tailored to our specific objectives."
Our Research Team & Methodology
Every Fundamental Business Insights report is built by a dedicated vertical research team, validated through a structured primary-and-secondary methodology, and reviewed for accuracy before it reaches you.
Research Team Overview
Prepared by the Energy & Power Research Team
Delivery
Published
Demand
Available
Support
Trust & Compliance
Research Domains
10 coverage areasResearch Intelligence
| Source Category | Research Sources | Purpose |
|---|---|---|
| Government Publications | Government agencies, statistical departments, regulatory bodies | Industry statistics, regulatory insights, and policy analysis |
| Company Disclosures | Annual reports, investor presentations, financial filings | Company performance, business strategy, and market positioning |
| Trade Associations | Industry associations and professional organizations | Industry developments, standards, and market perspectives |
| Technical Literature | Research papers, technical publications, academic journals | Technology developments and technical validation |
| Patent Analysis | Patent databases and intellectual property publications | Innovation trends, technology activity, and competitive research |
| Industry Databases | Established research databases and market intelligence resources | Market benchmarking, historical data, and industry analysis |
Research Workflow & Quality Assurance
Data Collection
Verified information gathered through primary and secondary research.
Data Triangulation
Cross-validation using multiple independent data sources.
Forecast Modelling
Market estimates developed using historical trends and analytical models.
Analyst Validation
Findings reviewed by domain experts for accuracy and consistency.
Editorial & Quality Review
Final editorial, quality, and compliance checks before publication.
Final Publication
Released after successful completion of the internal review process.
Report Coverage
📊 Market Assessment
- Market Size & Forecast
- Market Segmentation
- Regional Analysis
- Growth Drivers & Challenges
- Market Dynamics
🏢 Competitive Intelligence
- Competitive Landscape
- Company Profiles
- Competitive Benchmarking
- Mergers & Acquisitions
- Market Share Analysis or Key Company Strategies
🔍 Strategic Analysis
- Value Chain Analysis
- Porter's Five Forces
- PESTLE Analysis
- Pricing Trends
- Supply-Demand Analysis
🚀 Future Outlook
- Technology Landscape
- Regulatory Landscape
- Investment & Funding Landscape
- Emerging Opportunities
- Future Market Outlook
Have a question about this report or need a custom scope?
Request Customization