Static VAR Compensator Market Size & Growth Forecast 2027–2036, By Segments (Application, Product), Regional Demand Trends (North America, Asia Pacific, Europe), Key Country Insights (U.S., Japan, South Korea, Germany, France, Italy), and Competitive Landscape
Market Size and Growoth Outlook
Static VAR Compensator Market size was estimated at USD 30.59 Billion in 2026 and is projected to grow at 5.41% CAGR from 2027 to 2036, crossing USD 51.81 Billion by 2036. The industry revenue for 2027 is calculated at USD 31.99 Billion.
Get more details on this report
Request Free Sample ReportStatic VAR Compensator Market Intelligence Snapshot
Regional Market Dynamics
Segment Momentum
Market Expansion Drivers
Leading Market Participants
Global Market Forecast Snapshot
Market Outlook
Regional and Segment Outlook
Market Growth Drivers and Industry Trends
Rising grid stability requirements driving reactive power compensation system deployment
The increasing complexity of modern electricity networks is strengthening the need for advanced voltage control solutions, creating favorable conditions for the static VAR compensator market. Utilities and grid operators are investing in reactive power compensation technologies to maintain voltage stability, reduce transmission losses, and improve overall network reliability as electricity demand patterns become more dynamic. Industrial facilities with large fluctuating loads also rely on these systems to minimize voltage disturbances and maintain operational continuity, particularly in sectors where consistent power quality is essential for sensitive manufacturing processes and critical infrastructure.
Increasing renewable energy variability boosting voltage regulation infrastructure demand
Greater integration of renewable energy sources into power systems will drive the static VAR compensator market growth as grid operators address fluctuations associated with wind and solar generation. Variable renewable output introduces rapid changes in voltage and reactive power requirements, making dynamic compensation technologies increasingly important for maintaining stable grid performance. Static VAR compensators provide fast-response voltage regulation that supports reliable electricity transmission while improving the ability of networks to accommodate higher shares of renewable generation without compromising system efficiency or operational security.
Expansion of high-voltage transmission networks enhancing dynamic power quality control adoption
Ongoing investments in high-voltage transmission infrastructure are creating broader opportunities for the static VAR compensator market by increasing the demand for advanced power quality management solutions. Expanding transmission corridors and interregional grid connections require equipment capable of maintaining voltage profiles and supporting stable power transfer over long distances. Static VAR compensators help mitigate voltage fluctuations, improve transmission efficiency, and enhance system flexibility during varying load conditions, making them an integral component of modern transmission networks designed to accommodate growing electricity consumption and evolving generation sources.
| Growth Driver | Impact on CAGR | Regulatory Influence | Geographic Relevance | Adoption Rate | Impact Timeline |
|---|---|---|---|---|---|
| Rising grid stability requirements driving reactive power compensation system deployment | 2.2% | High | Asia Pacific, Europe | High | Near Term |
| Increasing renewable energy variability boosting voltage regulation infrastructure demand | 2.1% | High | North America, Europe | High | Mid Term |
| Expansion of high-voltage transmission networks enhancing dynamic power quality control adoption | 2% | High | Asia Pacific, Middle East | High | Mid Term |
Unlock insights tailored to your business with our bespoke market research solutions.
Click to get your customized report now.
Regional Demand Dynamics
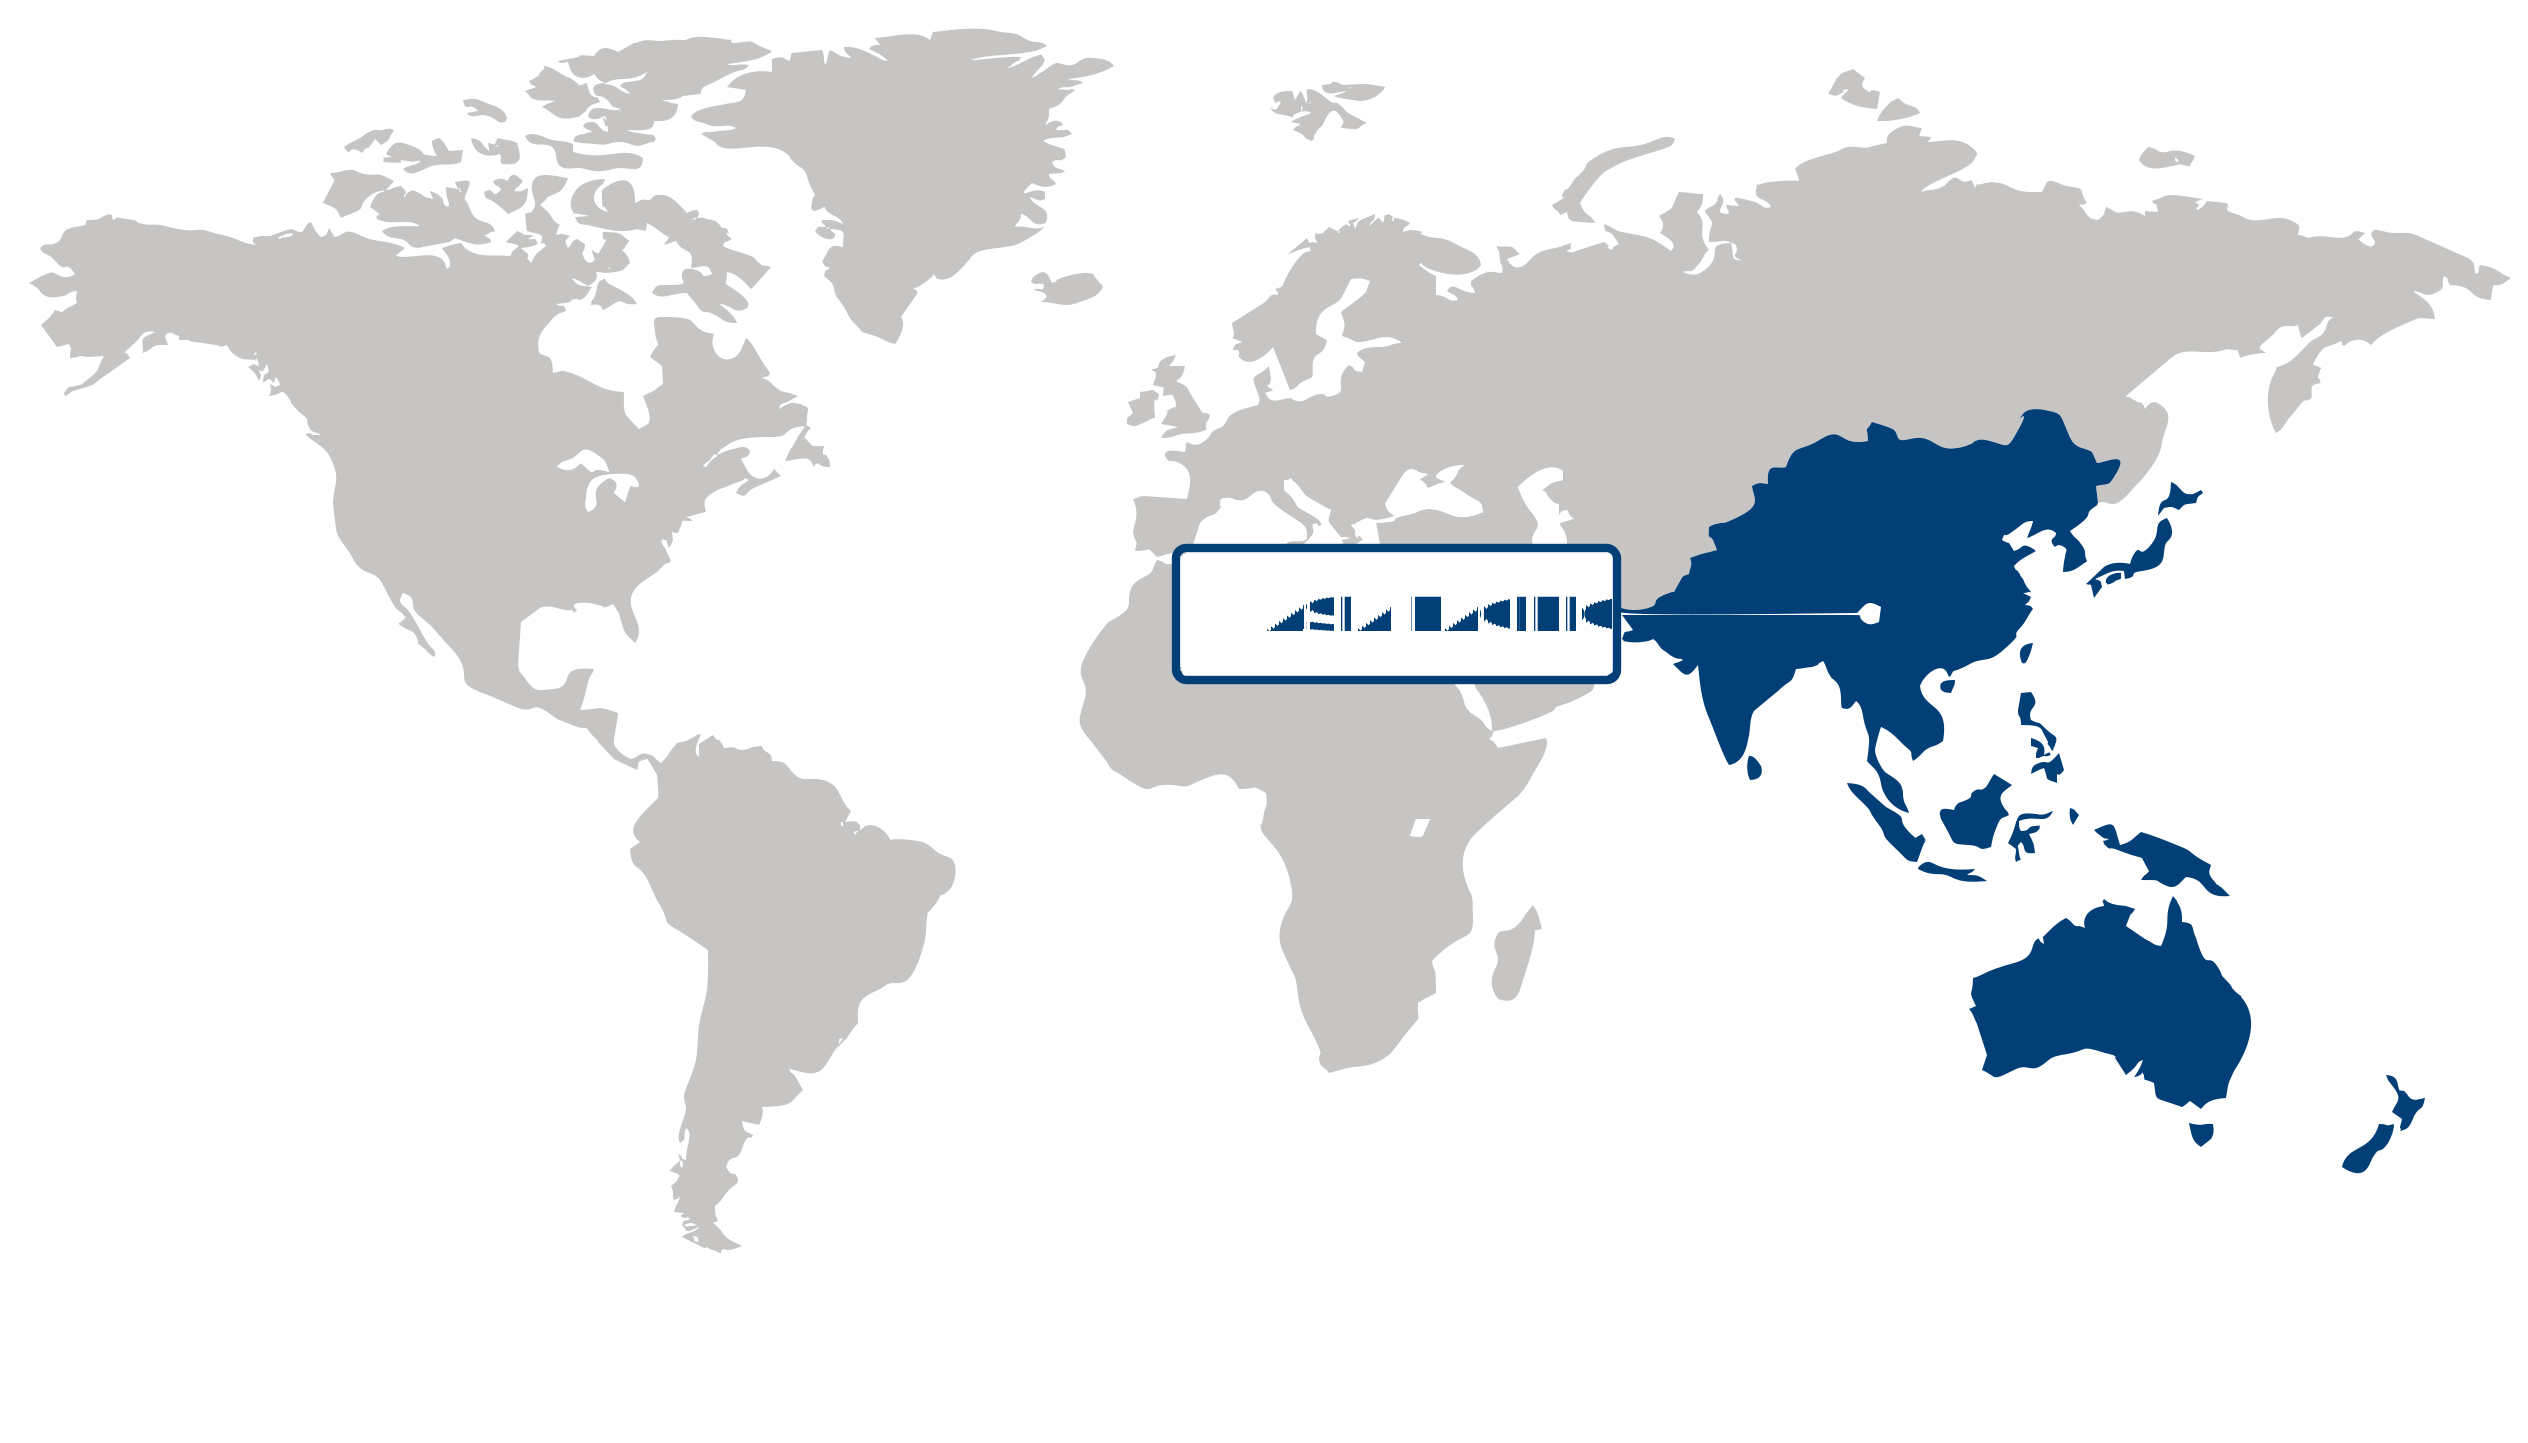
Asia Pacific (Largest & Fastest-Growing Region)
Asia Pacific led the static VAR compensator market in 2026 and is also expected to remain the fastest-growing region, supported by rapid industrialization, expanding power infrastructure, and increasing electricity demand. The development of manufacturing facilities, commercial infrastructure, and large-scale power networks is creating greater requirements for voltage regulation, power quality improvement, and grid stability. At the same time, rising integration of renewable energy sources is increasing the need for flexible power management technologies capable of addressing fluctuations in electricity supply. Investments in transmission and distribution infrastructure, grid modernization, and industrial electrification are therefore creating strong opportunities for static VAR compensators across the region.
| Parameter | North America | Asia Pacific | Europe | Latin America | MEA |
|---|---|---|---|---|---|
| Innovation Hub i Scale Nascent Developing Advanced | |||||
| Cost-Sensitive Region i Scale Low Medium High | |||||
| Regulatory Environment i Scale Restrictive Neutral Supportive | |||||
| Demand Drivers i Scale Weak Moderate Strong | |||||
| Development Stage i Scale Emerging Developing Developed | |||||
| Adoption Rate i Scale Low Medium High | |||||
| New Entrants / Startups i Scale Sparse Moderate Dense | |||||
| Macro Indicators i Scale Weak Stable Strong |
Key Country Insights
United States 🇺🇸
Grid Stability InvestmentThe U.S. static VAR compensator market is supported by transmission upgrades and increasing renewable energy integration. Utilities prioritize voltage stability, improved power quality, and grid reliability across expanding and modernized electricity networks.
Germany 🇩🇪
Renewable Grid IntegrationGermany deploys static VAR compensators to improve voltage regulation within renewable-heavy electricity networks. Utilities and industrial operators emphasize flexible reactive power management to maintain stable grid performance under changing load conditions.
Japan 🇯🇵
Power Network ReliabilityJapan focuses on static VAR compensators to enhance grid resilience and support reliable electricity delivery. Investments prioritize stable voltage control for urban infrastructure, industrial facilities, and renewable energy connections.
South Korea 🇰🇷
Industrial Power OptimizationSouth Korea applies static VAR compensators across industrial facilities and high-voltage transmission systems. Demand is driven by the need for efficient reactive power compensation and dependable electricity quality for advanced manufacturing operations.
France 🇫🇷
Transmission Modernization SupportFrance integrates static VAR compensators into grid modernization initiatives to strengthen voltage management. Utilities prioritize equipment capable of supporting renewable generation while maintaining operational efficiency across transmission infrastructure.
Italy 🇮🇹
Flexible Grid OperationsItaly is enhancing power network flexibility through greater deployment of static VAR compensators. Grid operators focus on improving voltage stability and accommodating renewable energy connections while supporting reliable electricity distribution.
Segment Leadership and Growth Trends
Static VAR Compensator Market Share (%), Product, 2025
Go beyond the chart, access full insights & data tables
Request Free Sample ReportApplication Segment Analysis: Utility (Largest & Fastest-Growing Segment)
The utility segment dominated the static VAR compensator market, accounting for the largest share of 44.63% in 2026. The growing need for grid stability, voltage regulation, and improved power quality across electricity networks has strengthened the adoption of static VAR compensators in utility applications. Power utilities increasingly rely on these systems to manage fluctuations caused by renewable energy integration, rising electricity demand, and complex transmission requirements. Static VAR compensators help enhance grid reliability by providing dynamic reactive power compensation, supporting efficient transmission operations, and maintaining stable voltage levels across power infrastructure. The continued modernization of electrical grids and focus on improving power system resilience are further supporting the expansion of this segment.
Product Segment Analysis: Thyristor-based (Largest & Fastest-Growing Segment)
The static VAR compensator market was led by the thyristor-based segment in 2026. Thyristor-based static VAR compensators are widely preferred due to their rapid response capabilities, effective voltage control, and suitability for applications requiring precise reactive power management. These systems offer reliable performance in large-scale power networks where maintaining grid stability and minimizing voltage disturbances are critical. Their ability to handle dynamic load variations and support transmission efficiency has contributed to their strong adoption across utility and industrial power systems. Increasing investments in advanced power management technologies and grid enhancement initiatives are expected to continue driving demand for thyristor-based solutions.
| Segment | Sub-Segment | Largest Segment | Fastest Growing |
|---|---|---|---|
| Product | Thyristor-based, MCR-based | ||
| Application | Utility, Railway, Industrial, Oil & gas, Others |
Competitive Landscape and Market Positioning
Major players in the static VAR compensator market:
- ABB Ltd. (Switzerland)
- Siemens Energy AG (Germany)
- GE Vernova (United States)
- Hitachi Energy Ltd. (Switzerland)
- Mitsubishi Electric Corporation (Japan)
- Eaton Corporation plc (Ireland)
- Toshiba Energy Systems & Solutions Corporation (Japan)
- Nidec Industrial Solutions (Japan)
- NR Electric Co., Ltd. (China)
- Sieyuan Electric Co., Ltd. (China)
Growing investment in grid modernization and industrial power quality is redirecting competitive emphasis toward engineering capabilities rather than standardized equipment manufacturing. Suppliers are increasingly distinguished by their ability to deliver customized system designs that integrate with complex transmission networks, renewable energy installations, and large industrial facilities while maintaining operational reliability under varying load conditions. Software-driven control systems, digital monitoring, and long-term service support are becoming more influential in procurement decisions, prompting vendors to expand their expertise in lifecycle performance alongside core power electronics technologies.
| Company | Market Share | Company Revenue | Revenue CAGR (%) | Product Portfolio | Geographic Presence | Innovation / R&D Focus | Strategic Developments |
|---|---|---|---|---|---|---|---|
| No companies available. | |||||||
Industry Development/News
| Company Name | Date | Key Development |
|---|---|---|
| GE Vernova | Dec-24 | Secured a contract from 50Hertz Transmission to deploy STATCOM units with grid-forming control technology at key substations in Germany. This initiative aims to maintain grid voltage stability and reliability amid the increasing integration of variable renewable energy sources, supporting the country's broader energy transition objectives. |
| Merus Power | Aug-24 | Finalized an agreement to supply two static synchronous compensators and a control system to GRK for Estonia's railway infrastructure. The solution is designed to optimize power supply and demand, mitigating network asymmetry caused by railway traction loads to ensure consistent power quality and grid reliability. |
| Hitachi Energy | Apr-24 | Awarded a contract by SP Energy Networks to deliver a combined SVC Light STATCOM and synchronous condenser solution for the Eccles substation in the UK. The project provides a dynamic power quality solution to fortify grid stability, facilitating increased renewable energy transmission from Scotland to England. |
Explore This Report
Click a section of the wheel — or its numbered marker — to preview the custom segmentation, custom table of contents, or related reports available for this market.
Static VAR Compensator Market — Custom Segments
| Segment | Sub-Segment |
|---|---|
| No segment data available. | |
Static VAR Compensator Market — report.custom
| Custom Chapter | Custom Details | ||
|---|---|---|---|
| No custom TOC data available. | |||
Need a different cut of the data?
Request Custom ResearchWhat is the market size of static VAR compensator?
What is the expected industry size of static VAR compensator by 2035?
Which part of the world represents the largest segment of the static VAR compensator industry?
Who is driving the fastest regional growth in the static VAR compensator sector?
Which is the largest sub-segment within the product segment for static VAR compensator industry?
Why does utility sub-segment dominate the application segment of static VAR compensator sector?
Which organizations are considered leaders in the static VAR compensator landscape?
Our Clients
"The reports offered a comprehensive view of the Food and Beverage landscape, covering market trends, consumer behavior, and competitive dynamics."
"Our experience in acquiring market research reports has been outstanding — the depth of analysis and actionable insights have proven invaluable."
"Fundamental Business Insights demonstrated a keen understanding of our business needs, delivering reports tailored to our specific objectives."
Our Research Team & Methodology
Every Fundamental Business Insights report is built by a dedicated vertical research team, validated through a structured primary-and-secondary methodology, and reviewed for accuracy before it reaches you.
Research Team Overview
Prepared by the Energy & Power Research Team
Delivery
Published
Demand
Available
Support
Trust & Compliance
Research Domains
10 coverage areasResearch Intelligence
| Source Category | Research Sources | Purpose |
|---|---|---|
| Government Publications | Government agencies, statistical departments, regulatory bodies | Industry statistics, regulatory insights, and policy analysis |
| Company Disclosures | Annual reports, investor presentations, financial filings | Company performance, business strategy, and market positioning |
| Trade Associations | Industry associations and professional organizations | Industry developments, standards, and market perspectives |
| Technical Literature | Research papers, technical publications, academic journals | Technology developments and technical validation |
| Patent Analysis | Patent databases and intellectual property publications | Innovation trends, technology activity, and competitive research |
| Industry Databases | Established research databases and market intelligence resources | Market benchmarking, historical data, and industry analysis |
Research Workflow & Quality Assurance
Data Collection
Verified information gathered through primary and secondary research.
Data Triangulation
Cross-validation using multiple independent data sources.
Forecast Modelling
Market estimates developed using historical trends and analytical models.
Analyst Validation
Findings reviewed by domain experts for accuracy and consistency.
Editorial & Quality Review
Final editorial, quality, and compliance checks before publication.
Final Publication
Released after successful completion of the internal review process.
Report Coverage
📊 Market Assessment
- Market Size & Forecast
- Market Segmentation
- Regional Analysis
- Growth Drivers & Challenges
- Market Dynamics
🏢 Competitive Intelligence
- Competitive Landscape
- Company Profiles
- Competitive Benchmarking
- Mergers & Acquisitions
- Market Share Analysis or Key Company Strategies
🔍 Strategic Analysis
- Value Chain Analysis
- Porter's Five Forces
- PESTLE Analysis
- Pricing Trends
- Supply-Demand Analysis
🚀 Future Outlook
- Technology Landscape
- Regulatory Landscape
- Investment & Funding Landscape
- Emerging Opportunities
- Future Market Outlook
Have a question about this report or need a custom scope?
Request Customization