Vanillic Acid Market Size & Growth Forecast 2026–2035, By Segments (Purity, Application), Regional Demand Trends (North America, Asia Pacific, Europe), Key Country Insights (U.S., Japan, South Korea, Germany, France, Italy), and Competitive Landscape
Market Size and Growoth Outlook
Vanillic Acid Market size stood at USD 21.27 Billion in 2025 and is predicted to grow at a 2.3% CAGR from 2026 to 2035, surpassing USD 26.7 Billion by 2035. The industry revenue for 2026 is estimated at USD 21.69 billion.
Get more details on this report
Request Free Sample ReportVanillic Acid Market Intelligence Snapshot
Regional Market Dynamics
- Asia Pacific held a 33.92% market share in 2025, supported by its strong manufacturing base, established chemical processing capacity, and efficient production for domestic and export markets.
- Europe is projected to grow at a 2.62% CAGR, supported by demand from quality-sensitive food, personal care, and specialty chemical industries requiring consistent, specification-driven ingredient sourcing.
Segment Momentum
- Purity 98% accounted for 56.7% of the market in 2025 by balancing reliable performance with broader commercial usability, making it the preferred choice for volume-driven applications focused on consistent supply and cost efficiency.
- Purity 99% is the fastest-growing segment as buyers increasingly require tighter formulation standards, higher consistency, and lower impurity levels for quality-sensitive end-use applications.
Market Expansion Drivers
- Rising demand for natural and organic ingredients across food and cosmetic formulations.
- Expanding use as flavoring and fragrance additive in food and perfumery applications.
- Tightening purity standards and supply constraints driving optimized production and sourcing strategies.
Leading Market Participants
Global Market Forecast Snapshot
Market Outlook
Top players in the vanillic acid market include Solvay S.A. (Belgium), BASF SE (Germany), Lanxess AG (Germany), Parchem Fine & Specialty Chemicals (United States), Otto Chemie Pvt. Ltd. (India), Quzhou Mingfeng Chemical Co., Ltd. (China), Donglian Nankai Flavor Co., Ltd. (China), International Flavors & Fragrances Inc. (United States).Regional and Segment Outlook
Asia PacificMarket Growth Drivers and Industry Trends
As food manufacturers and personal care brands reformulate around cleaner labels and plant-derived inputs, vanillic acid market demand is being reinforced by its fit with ingredient strategies centered on naturally associated aromatic compounds and recognizable sourcing narratives. In practice, This transitions procurement toward specialty ingredients that can support both formulation performance and brand positioning, especially in premium products where synthetic additives are being reduced or replaced. The vanillic acid market benefits as formulators look for multifunctional ingredients that align with natural product development pipelines, increasing market presence in applications where sensory profile, ingredient transparency, and perceived product authenticity influence purchasing decisions.
Expanding use as flavoring and fragrance additive in food and perfumery applications
Broader use in flavor and fragrance systems is encouraging market growth by linking vanillic acid market growth to product development activity in two high-value formulation segments. In food applications, its aromatic properties make it relevant to manufacturers refining taste profiles in bakery, confectionery, and beverage products, while in perfumery it serves demand for nuanced scent construction and ingredient diversification. This practical pull from formulators strengthens market development because purchasing is tied not only to volume needs but also to recurring innovation cycles, where even small changes in sensory design can create sustained ingredient demand and deepen supplier relationships.
Tightening purity standards and supply constraints driving optimized production and sourcing strategies
Stricter quality expectations and constrained raw material availability are reshaping buying behavior in the vanillic acid market by pushing producers and downstream users to prioritize process control, supplier qualification, and more resilient sourcing models. When purity thresholds become more critical for food, cosmetic, and fragrance applications, inconsistent supply carries a higher commercial risk, prompting investment in purification efficiency, traceability, and longer-term procurement arrangements. This dynamic contributes to market size growth by favoring manufacturers that can reliably deliver specification-grade material, while also influencing pricing discipline and purchasing decisions among buyers that need continuity without compromising formulation standards.
| Growth Driver | Impact on CAGR | Regulatory Influence | Geographic Relevance | Adoption Rate | Impact Timeline |
|---|---|---|---|---|---|
| Use in Food, Cosmetic & Pharmaceutical Applications | 0.90% | Short term (≤ 2 yrs) | North America, Europe (spillover: Asia Pacific) | Medium | Fast |
| Technological Developments in Extraction & Purification | 0.80% | Medium term (2–5 yrs) | Europe, North America (spillover: Asia Pacific) | Low | Moderate |
| Regulatory Compliance & Safety Standards | 0.60% | Long term (5+ yrs) | North America, Europe (spillover: MEA) | High | Moderate |
| Rising demand for natural and organic ingredients across food and cosmetic formulations | 1.60% | Moderate | Asia Pacific, North America, Europe | Medium | Mid Term |
| Expanding use as flavoring and fragrance additive in food and perfumery applications | 1.30% | Moderate | Asia Pacific, Europe | High | Near Term |
| Tightening purity standards and supply constraints driving optimized production and sourcing strategies | 0.90% | High | Asia Pacific, Europe | Emerging | Long Term |
Unlock insights tailored to your business with our bespoke market research solutions.
Click to get your customized report now.
Regional Demand Dynamics
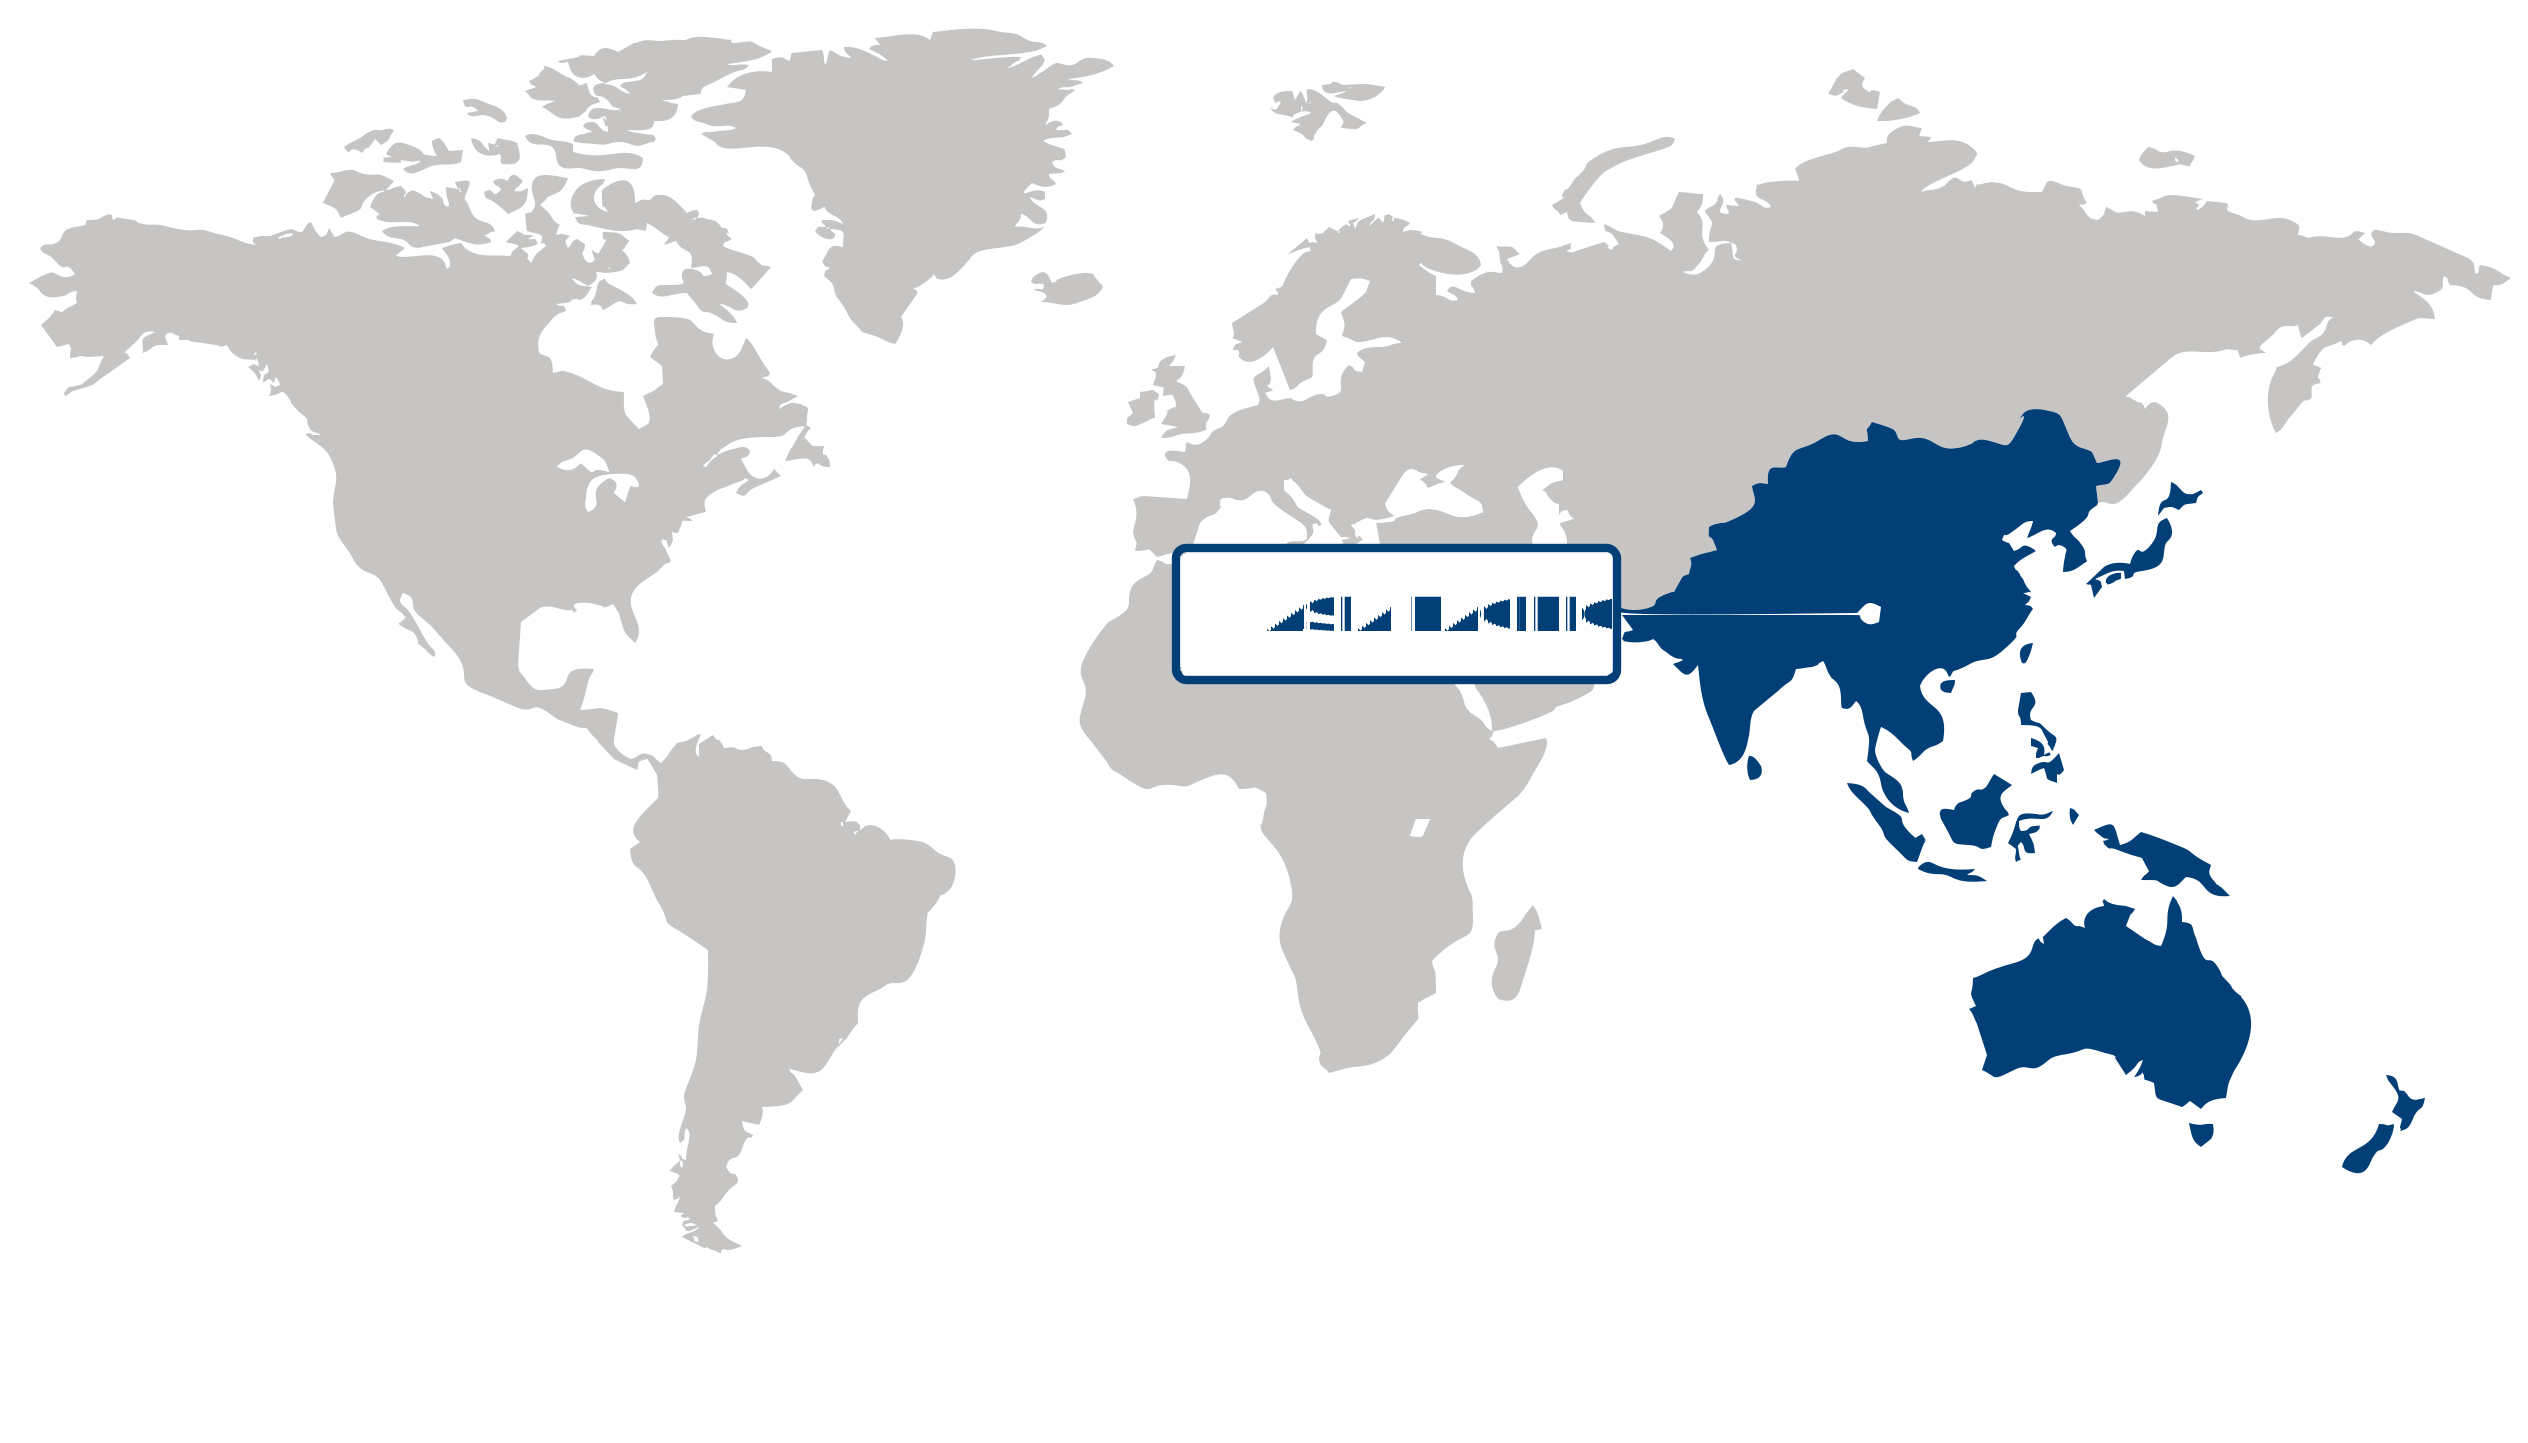
Asia Pacific held the leading position in 2025, accounting for a 33.92% share of the vanillic acid market. This leadership is supported by the region’s broad manufacturing base for food ingredients, flavors, fragrances, and pharmaceutical intermediates, which keeps procurement and production activity closely tied to end-use demand. The region’s position is further aided by established chemical processing capacity and cost-efficient production environments that enable manufacturers to serve both domestic consumption and export requirements with operational flexibility.
Europe is projected to expand at a 2.62% CAGR over the forecast period in the vanillic acid market, with growth being propelled by steady demand from regulated, quality-sensitive end-use industries. Adoption is advancing through applications where formulation consistency, purity standards, and controlled ingredient sourcing matter in practice, particularly across food, personal care, and specialty chemical uses. This makes the region’s growth less about volume expansion alone and more about the continued pull from value-added applications that require dependable supply and specification-driven purchasing.
| Parameter | North America | Asia Pacific | Europe | Latin America | MEA |
|---|---|---|---|---|---|
| Innovation Hub i Scale Nascent Developing Advanced | |||||
| Cost-Sensitive Region i Scale Low Medium High | |||||
| Regulatory Environment i Scale Restrictive Neutral Supportive | |||||
| Demand Drivers i Scale Weak Moderate Strong | |||||
| Development Stage i Scale Emerging Developing Developed | |||||
| Adoption Rate i Scale Low Medium High | |||||
| New Entrants / Startups i Scale Sparse Moderate Dense | |||||
| Macro Indicators i Scale Weak Stable Strong |
Key Country Insights
Germany 🇩🇪
High-Purity Production FocusGermany prioritizes high-purity vanillic acid for pharmaceutical intermediates, specialty chemicals, and premium personal care applications. Companies continue refining production processes that align with stringent quality standards and environmentally responsible manufacturing practices.
France 🇫🇷
Natural Aroma ApplicationsFrance supports vanillic acid demand through flavor, fragrance, and premium cosmetic manufacturing that values naturally derived aromatic ingredients. Companies increasingly integrate sustainable sourcing strategies while maintaining formulation quality and product differentiation.
Italy 🇮🇹
Value-Added Ingredient SupplyItaly utilizes vanillic acid in food ingredients, specialty chemicals, and cosmetic formulations requiring dependable raw material quality. Manufacturers emphasize flexible sourcing and formulation performance to support diverse industrial applications.
Japan 🇯🇵
Functional Ingredient DevelopmentJapan applies vanillic acid across advanced food ingredients, cosmetics, and health-related formulations emphasizing product quality and formulation precision. Domestic manufacturers increasingly value reliable supply and application-specific ingredient customization.
South Korea 🇰🇷
Cosmetic Ingredient IntegrationSouth Korea incorporates vanillic acid into skincare and beauty formulations where naturally inspired active ingredients remain a product development priority. Producers focus on ingredient consistency and compatibility with innovative cosmetic formulations.
United States 🇺🇸
Specialty Ingredient InnovationThe U.S. emphasizes vanillic acid for flavor, fragrance, nutraceutical, and cosmetic formulations where naturally derived ingredients are gaining preference. Manufacturers increasingly focus on sustainable sourcing and consistent purity to support premium product development.
Segment Leadership and Growth Trends
Vanillic Acid Market Share (%), Purity, 2025
Go beyond the chart, access full insights & data tables
Request Free Sample ReportWithin the vanillic acid market, Purity 98% held the dominant position in 2025 with a 56.7% share. its position is underpinned by the balance it offers between acceptable purity performance and broader usability across routine commercial requirements, making it a practical choice where consistent supply and cost discipline matter more than incremental purity gains. This keeps Purity 98% firmly established across volume-driven demand in the vanillic acid market.
Purity 99% is emerging as the fastest-growing segment in the vanillic acid market as buyers increasingly align procurement with tighter formulation standards and more demanding end-use quality requirements. Its momentum over lower-purity alternatives comes from the need for greater consistency and reduced impurity tolerance in applications where product precision directly affects performance, making Purity 99% the preferred upgrade path as specification expectations rise.
Application Segment Analysis: Flavors and Fragrances (Largest & Fastest-Growing Segment)
In 2025, Flavors and Fragrances accounted for a 53.55% share of the vanillic acid market, making it both the largest and fastest-growing application segment. Its leadership reflects the established use of vanillic acid in aroma and flavor formulation, where dependable sensory characteristics support steady commercial demand. The same application is also gaining momentum because product developers continue to rely on ingredients that help fine-tune fragrance and flavor profiles with consistency, allowing Flavors and Fragrances to expand faster than other uses within the vanillic acid market.
| Segment | Sub-Segment | Largest Segment | Fastest Growing |
|---|---|---|---|
| Purity | Purity 99%, Purity 98%, Others | Purity 98% | Purity 99% |
| Application | Pharmaceutical Intermediates, Flavors and Fragrances, Others | Flavors and Fragrances | Flavors and Fragrances |
Competitive Landscape and Market Positioning
1. Solvay S.A. (Belgium)
2. BASF SE (Germany)
3. Lanxess AG (Germany)
4. Parchem Fine & Specialty Chemicals (United States)
5. Otto Chemie Pvt. Ltd. (India)
6. Quzhou Mingfeng Chemical Co. Ltd. (China)
7. Donglian Nankai Flavor Co. Ltd. (China)
8. International Flavors & Fragrances Inc. (United States)
The vanillic acid market is expanding through increasing utilization in pharmaceuticals, cosmetics, and specialty chemical applications. Innovation is centered on enhancing purity and broadening functional applications. The vanillic acid market continues to evolve with growing interest in bio-based aromatic compounds.
| Company | Market Share | Company Revenue | Revenue CAGR (%) | Product Portfolio | Geographic Presence | Innovation / R&D Focus | Strategic Developments |
|---|---|---|---|---|---|---|---|
| No companies available. | |||||||
Industry Development/News
| Company Name | Date | Key Development |
|---|
Explore This Report
Click a section of the wheel — or its numbered marker — to preview the custom segmentation, custom table of contents, or related reports available for this market.
Vanillic Acid Market — Custom Segments
| Segment | Sub-Segment |
|---|---|
| No segment data available. | |
Vanillic Acid Market — report.custom
| Custom Chapter | Custom Details | ||
|---|---|---|---|
| No custom TOC data available. | |||
Need a different cut of the data?
Request Custom ResearchHow big is the vanillic acid market?
How will the vanillic acid industry grow in terms of size and CAGR by 2035?
How are higher purity requirements reshaping purchasing behavior in the vanillic acid market?
What is driving sustained demand for vanillic acid in flavors and fragrances?
Why is Purity 98% the largest purity segment in the vanillic acid market?
Which purity segment is growing fastest in the vanillic acid market?
Why does Asia Pacific hold the largest share of the vanillic acid market?
What is driving vanillic acid market growth in Europe?
Who are the major participants shaping the vanillic acid landscape?
Our Clients
"The reports offered a comprehensive view of the Food and Beverage landscape, covering market trends, consumer behavior, and competitive dynamics."
"Our experience in acquiring market research reports has been outstanding — the depth of analysis and actionable insights have proven invaluable."
"Fundamental Business Insights demonstrated a keen understanding of our business needs, delivering reports tailored to our specific objectives."
Our Research Team & Methodology
Every Fundamental Business Insights report is built by a dedicated vertical research team, validated through a structured primary-and-secondary methodology, and reviewed for accuracy before it reaches you.
Research Team Overview
Prepared by the Chemicals & Materials Research Team
Delivery
Published
Demand
Available
Support
Trust & Compliance
Research Domains
10 coverage areasResearch Intelligence
| Source Category | Research Sources | Purpose |
|---|---|---|
| Government Publications | Government agencies, statistical departments, regulatory bodies | Industry statistics, regulatory insights, and policy analysis |
| Company Disclosures | Annual reports, investor presentations, financial filings | Company performance, business strategy, and market positioning |
| Trade Associations | Industry associations and professional organizations | Industry developments, standards, and market perspectives |
| Technical Literature | Research papers, technical publications, academic journals | Technology developments and technical validation |
| Patent Analysis | Patent databases and intellectual property publications | Innovation trends, technology activity, and competitive research |
| Industry Databases | Established research databases and market intelligence resources | Market benchmarking, historical data, and industry analysis |
Research Workflow & Quality Assurance
Data Collection
Verified information gathered through primary and secondary research.
Data Triangulation
Cross-validation using multiple independent data sources.
Forecast Modelling
Market estimates developed using historical trends and analytical models.
Analyst Validation
Findings reviewed by domain experts for accuracy and consistency.
Editorial & Quality Review
Final editorial, quality, and compliance checks before publication.
Final Publication
Released after successful completion of the internal review process.
Report Coverage
📊 Market Assessment
- Market Size & Forecast
- Market Segmentation
- Regional Analysis
- Growth Drivers & Challenges
- Market Dynamics
🏢 Competitive Intelligence
- Competitive Landscape
- Company Profiles
- Competitive Benchmarking
- Mergers & Acquisitions
- Market Share Analysis or Key Company Strategies
🔍 Strategic Analysis
- Value Chain Analysis
- Porter's Five Forces
- PESTLE Analysis
- Pricing Trends
- Supply-Demand Analysis
🚀 Future Outlook
- Technology Landscape
- Regulatory Landscape
- Investment & Funding Landscape
- Emerging Opportunities
- Future Market Outlook
Have a question about this report or need a custom scope?
Request Customization