Virtual Cards Market Size & Growth Forecast 2026–2035, By Segments (Card Type, Application, Product Type), Regional Demand Trends (North America, Asia Pacific, Europe), Key Country Insights (U.S., Japan, South Korea, Germany, France, Italy), and Competitive Landscape
Market Size and Growoth Outlook
Virtual Cards Market size was valued at USD 22.03 Billion in 2025 and is anticipated to grow at a 20.6% CAGR from 2026 to 2035, exceeding USD 143.38 Billion by 2035. The industry revenue for 2026 is estimated at USD 26.16 billion.
Get more details on this report
Request Free Sample ReportVirtual Cards Market Intelligence Snapshot
Regional Market Dynamics
- Europe holds 39.52% share due to mature digital payments infrastructure, strong enterprise adoption of card-based workflows, and widespread use in controlled B2B spending environments.
- Asia Pacific is expanding at 22.66% CAGR, driven by rapid payment digitization, embedded finance adoption, and shift toward mobile-first, automated transaction systems.
Segment Momentum
- Business Use accounted for 66.54% of the market in 2025 as organizations rely on virtual cards to improve vendor payments, employee expense management, procurement controls, and transaction visibility.
- Debit Card is the fastest-growing card type as users increasingly prefer direct fund access, stronger spending control, and secure virtual payments for everyday digital commerce.
Market Expansion Drivers
- Rising global digital payment transactions accelerating virtual card adoption across consumer and business segments.
- Increasing use of tokenization technologies strengthening secure digital payment infrastructure demand.
- Expanding smartphone penetration and internet access boosting mobile-based virtual payment solutions.
Leading Market Participants
Global Market Forecast Snapshot
Market Outlook
Leading players in the virtual cards market include American Express Company (United States), Mastercard Incorporated (United States), Stripe, Inc. (United States), Marqeta, Inc. (United States), Adyen N.V. (Netherlands), JPMorgan Chase & Co. (United States), Wise Payments Limited (United Kingdom), WEX Inc. (United States), Block, Inc. (United States), Airwallex Pty Ltd. (Australia).Regional and Segment Outlook
EuropeMarket Growth Drivers and Industry Trends
As digital commerce becomes routine for both retail purchases and enterprise spending, the virtual cards market is benefiting from a payment environment that increasingly favors instant issuance, remote use, and tighter transaction control. Consumers are shifting more of their spending to app-based and online channels where virtual cards fit naturally as a safer substitute for physical cards, while businesses are using them to manage supplier payments, employee expenses, and subscription spending with greater visibility. This rise in transaction volume is influencing market adoption by pushing issuers, fintech platforms, and corporate payment providers to expand virtual card capabilities as a practical response to growing demand for speed, security, and spend governance in digital-first payment flows.
Increasing use of tokenization technologies strengthening secure digital payment infrastructure demand
The wider deployment of tokenization is reinforcing the technical foundation that makes virtual cards easier to trust and integrate into modern payment systems. In the virtual cards market, tokenization reduces exposure of underlying card credentials by replacing sensitive data with transaction-specific or merchant-specific tokens, which aligns well with the temporary and controlled-use nature of virtual card products. That security architecture is shaping issuer and merchant decisions in practice, as payment providers invest more heavily in virtual card programs that can lower fraud risk, improve approval confidence in digital channels, and support secure card-on-file transactions without relying on static primary account details.
Expanding smartphone penetration and internet access boosting mobile-based virtual payment solutions
Broader access to smartphones and reliable internet is increasing the frequency of mobile-led transactions, creating favorable conditions for virtual cards that can be generated, stored, and used entirely through digital interfaces. The virtual cards market is seeing stronger demand from users who expect payments to be embedded into banking apps, digital wallets, expense platforms, and e-commerce checkouts rather than tied to physical card distribution. This trend is aiding market expansion by making virtual card access more immediate and scalable, especially as financial institutions and fintech companies design mobile-first user journeys that reduce onboarding friction and encourage repeated use for everyday payments, travel bookings, and business disbursements.
| Growth Driver | Impact on CAGR | Regulatory Influence | Geographic Relevance | Adoption Rate | Impact Timeline |
|---|---|---|---|---|---|
| Rising global digital payment transactions accelerating virtual card adoption across consumer and business segments | 2.30% | Moderate | Europe, Asia Pacific, North America | High | Near Term |
| Increasing use of tokenization technologies strengthening secure digital payment infrastructure demand | 2.00% | High | Europe, North America | High | Mid Term |
| Expanding smartphone penetration and internet access boosting mobile-based virtual payment solutions | 1.80% | Moderate | Asia Pacific, Latin America | High | Near Term |
Unlock insights tailored to your business with our bespoke market research solutions.
Click to get your customized report now.
Regional Demand Dynamics
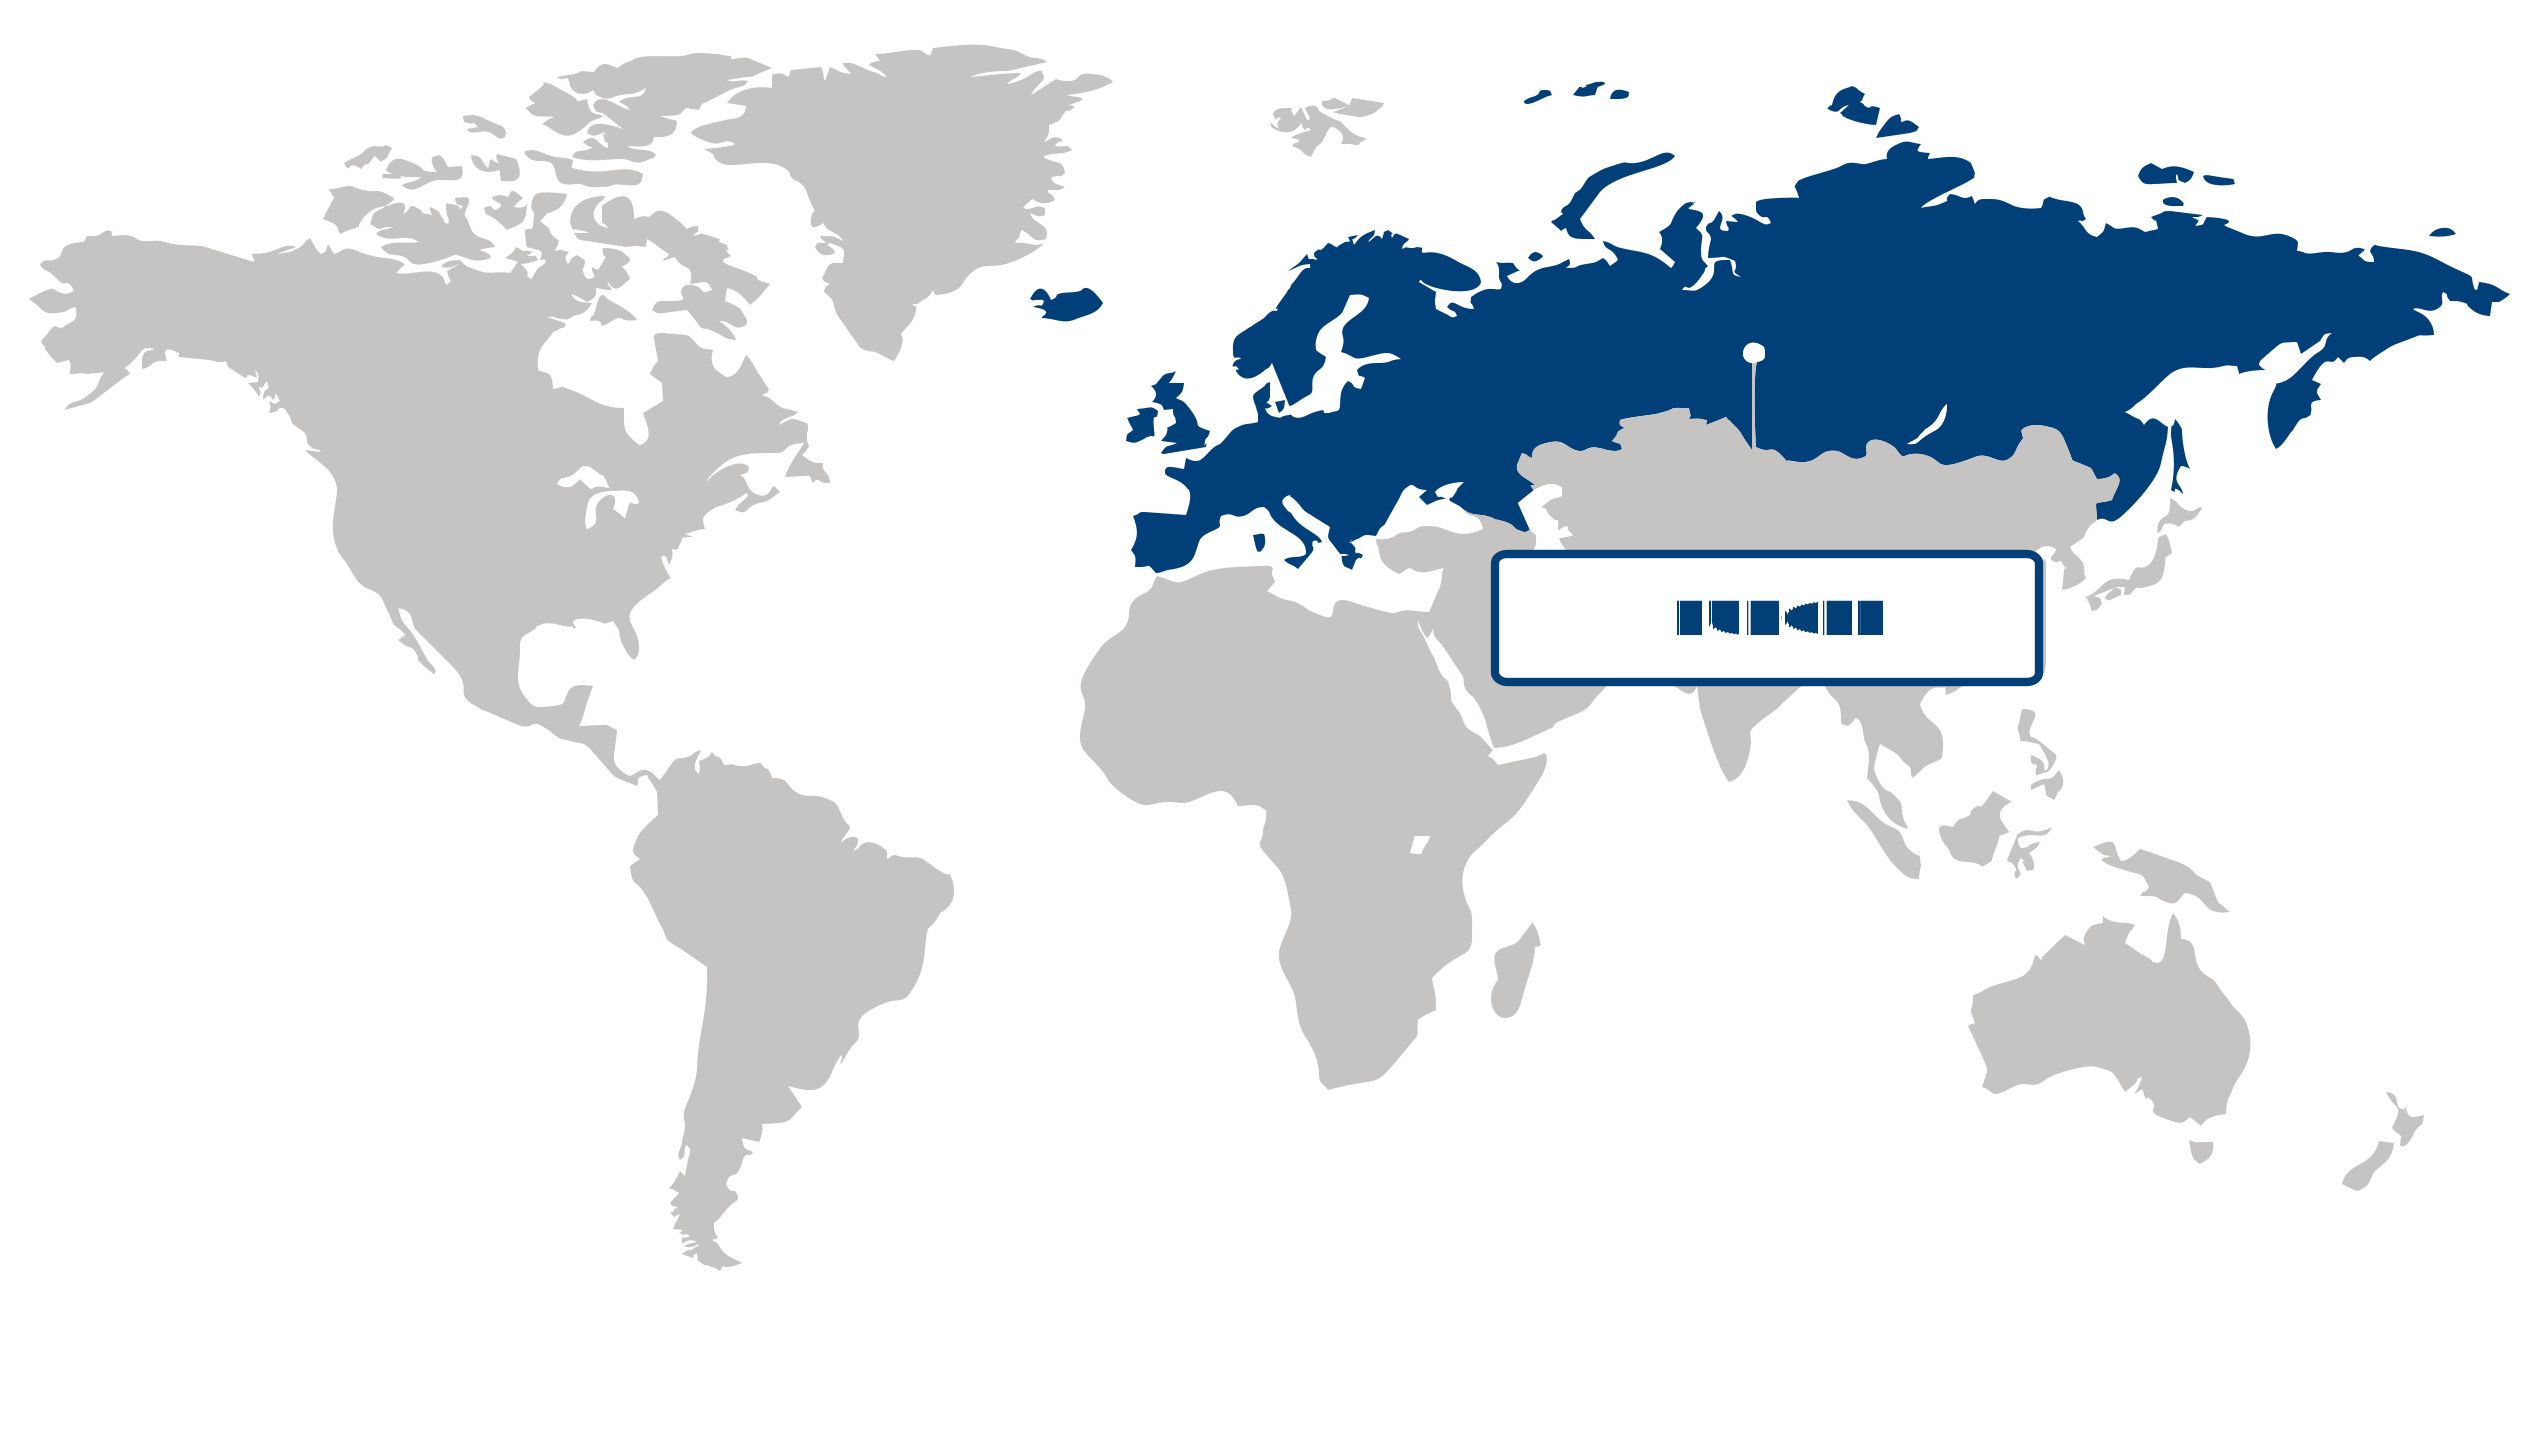
Europe held a 39.52% share of the virtual cards market in 2025, supported by the region’s mature digital payments infrastructure, broad enterprise adoption of electronic expense and procurement workflows, and strong penetration of card-based B2B transactions. Market leadership is underpinned by the practical use of virtual cards across corporate travel, supplier payments, and controlled spending environments where businesses prioritize security, traceability, and automated reconciliation. This operating environment keeps issuance and transaction activity concentrated across established financial institutions and payment platforms in the region.
Asia Pacific is projected to expand at a 22.66% CAGR over the forecast period, with growth in the virtual cards market being propelled by rapid digitization of business payments, rising adoption of embedded financial services, and the widening use of mobile-first transaction ecosystems across enterprises and consumers. Demand is accelerating as businesses in the region move away from manual payment methods toward scalable digital tools that offer faster issuance, tighter spend controls, and easier integration into online commerce and cross-border payment flows. Strong uptake in digitally advancing economies is translating into higher acceptance and broader day-to-day usage across multiple payment scenarios.
| Parameter | North America | Asia Pacific | Europe | Latin America | MEA |
|---|---|---|---|---|---|
| Innovation Hub i Scale Nascent Developing Advanced | |||||
| Cost-Sensitive Region i Scale Low Medium High | |||||
| Regulatory Environment i Scale Restrictive Neutral Supportive | |||||
| Demand Drivers i Scale Weak Moderate Strong | |||||
| Development Stage i Scale Emerging Developing Developed | |||||
| Adoption Rate i Scale Low Medium High | |||||
| New Entrants / Startups i Scale Sparse Moderate Dense | |||||
| Macro Indicators i Scale Weak Stable Strong |
Key Country Insights
Germany 🇩🇪
Corporate Procurement FocusGermany emphasizes virtual cards for disciplined procurement and controlled corporate spending across manufacturing and service industries. Organizations in Germany increasingly align virtual card adoption with ERP integration, invoice automation, and compliance-driven financial processes.
France 🇫🇷
Secure Commercial PaymentsFrance is strengthening virtual card adoption through growing demand for secure commercial transactions and controlled corporate spending. Businesses in France focus on payment transparency, fraud mitigation, and streamlined reconciliation across domestic and cross-border operations.
Italy 🇮🇹
SME Digital PaymentsItaly is seeing wider virtual card adoption as small and medium-sized businesses digitize procurement and business payments. Organizations in Italy are prioritizing flexible payment solutions that simplify expense tracking while supporting broader financial digitalization initiatives.
Japan 🇯🇵
Digital Expense ModernizationJapan is expanding virtual card usage as businesses modernize payment workflows while maintaining stringent security standards. Companies in Japan prioritize seamless integration with corporate accounting systems and digital expense management to support operational efficiency.
South Korea 🇰🇷
Mobile Payment IntegrationSouth Korea benefits from a digitally connected payment ecosystem where virtual cards complement mobile commerce and online business transactions. Enterprises in South Korea increasingly deploy virtual cards for secure vendor payments, employee expenses, and digital service subscriptions.
United States 🇺🇸
Enterprise Payment InnovationThe U.S. virtual cards market is shaped by strong enterprise demand for secure B2B payments, subscription management, and expense automation. Businesses in the U.S. continue to integrate virtual cards with digital procurement, travel, and financial management platforms to improve payment control and reduce fraud exposure.
Segment Leadership and Growth Trends
Virtual Cards Market Share (%), Card Type, 2025
Go beyond the chart, access full insights & data tables
Request Free Sample ReportCredit Card held the leading position in the virtual cards market in 2025, accounting for a 58.78% share. This leadership is underpinned by the strong fit of virtual credit cards with corporate payments, travel spending, subscription management, and controlled procurement workflows, where deferred payment functionality and spending limits are operationally useful. Across the virtual cards market, businesses and financial institutions continue to rely on credit card structures because they align well with expense oversight, reconciliation processes, and fraud control requirements in high-volume digital payment environments.
Debit Card is emerging as the fastest-growing segment in the virtual cards market as users increasingly prefer direct access to funds and tighter day-to-day spending control. Its momentum is being aided by rising adoption among individuals and smaller users who want the convenience of virtual payments without depending on revolving credit. Compared with credit-based alternatives, virtual debit cards are seeing wider adoption because they better match the shift toward real-time budgeting behavior and practical payment use cases tied to everyday digital commerce.
Application Segment Analysis: Business Use (Largest Segment) vs Consumer Use (Fastest-Growing Segment)
Business Use remained the dominant application in the virtual cards market in 2025, with a 66.54% share. Its leadership reflects the clear operational value virtual cards provide in managing vendor payments, employee expenses, procurement activity, and recurring service payments within structured business environments. In the virtual cards market, enterprises benefit from stronger transaction visibility, policy-based spend controls, and easier reconciliation, which keeps business use firmly ahead as organizations continue digitizing payment workflows.
Consumer Use is the fastest-growing application in the virtual cards market, encouraged by the expanding use of digital payments for online shopping, subscriptions, and app-based transactions. Growth is accelerating as consumers place greater emphasis on payment security and prefer virtual card credentials for transactions where exposing primary card details is less desirable. Relative to business use, this segment is gaining momentum from broader everyday adoption patterns, especially where convenience and safer online checkout behavior are becoming standard consumer expectations.
| Segment | Sub-Segment | Largest Segment | Fastest Growing |
|---|---|---|---|
| Card Type | Debit Card, Credit Card | Credit Card | Debit Card |
| Application | Consumer Use, Business Use | Business Use | Consumer Use |
| Product Type | B2B Virtual Cards, B2C Remote Payment Virtual Cards, C2B POS Virtual Cards | B2B Virtual Cards | B2C Remote Payment Virtual Cards |
Competitive Landscape and Market Positioning
1. American Express Company (United States)
2. Mastercard Incorporated (United States)
3. Stripe Inc. (United States)
4. Marqeta Inc. (United States)
5. Adyen N.V. (Netherlands)
6. JPMorgan Chase & Co. (United States)
7. Wise Payments Limited (United Kingdom)
8. WEX Inc. (United States)
9. Block Inc. (United States)
10. Airwallex Pty Ltd. (Australia)
Growing preference for secure and contactless payment methods is accelerating innovation within the virtual cards market. Providers are strengthening fraud prevention features, real-time transaction controls, and integration with digital banking ecosystems to enhance user experience. Rising adoption of remote transactions and subscription-based services is also supporting broader market expansion across commercial and consumer applications.
| Company | Market Share | Company Revenue | Revenue CAGR (%) | Product Portfolio | Geographic Presence | Innovation / R&D Focus | Strategic Developments |
|---|---|---|---|---|---|---|---|
| No companies available. | |||||||
Industry Development/News
| Company Name | Date | Key Development |
|---|---|---|
| Extend | Mar-24 | Extend raised $20 million in funding to accelerate the development and market expansion of its virtual card and expense management platform. This capital injection underscores the growing investor confidence in digital-first B2B payment solutions and provides the necessary resources to scale the company's technical infrastructure and enterprise capabilities. |
| J.P. Morgan Payments & Mastercard | Mar-24 | J.P. Morgan Payments and Mastercard introduced a B2B virtual card solution across the European market. The integration is designed to streamline accounts payable and supplier payment processes, offering businesses greater control and security for complex transactions while strengthening the firms' competitive positioning in the digital commercial payments space. |
| Coupa & SMCC | Mar-24 | Coupa and Sumitomo Mitsui Card Company (SMCC) formed a strategic partnership to introduce B2B virtual card capabilities in Japan. This collaboration enables enterprises to digitize their procurement and supplier payment workflows, addressing a critical need for automation and financial visibility within the Japanese corporate landscape. |
| Qolo & KeyBank | Mar-24 | Qolo expanded its partnership with KeyBank to launch the Key Virtual Card (KeyVC). By integrating virtual card issuance directly into KeyBank’s treasury management platform, the companies enable commercial clients to create, manage, and track virtual payments, significantly enhancing corporate liquidity management and streamlining back-office financial operations. |
| HDFC Bank & Visa | May-24 | HDFC Bank launched the PIXEL virtual credit card in collaboration with Visa, fully integrated into the PayZapp mobile application. The solution provides customizable financial tools and real-time management features, reflecting a strategic shift toward digitizing consumer credit through seamless app-based experiences tailored to tech-savvy user segments. |
| Extend & PNC Bank | Mar-24 | Extend and PNC Bank partnered to modernize commercial card payments by integrating virtual card issuance and spend management capabilities for business customers. This initiative allows PNC to offer its commercial clients enhanced security and granular control over corporate spending, effectively bridging traditional banking services with agile, digital-native payment workflows. |
| Mastercard & Aquapay | Aug-24 | Mastercard and Aquapay introduced the In Control for Business Travel solution in India. By enabling travel management companies to issue virtual cards for central travel accounts, the partnership improves payment efficiency and security, providing a scalable framework for managing business travel expenses within the Indian corporate market. |
| Lloyds & Taulia | Mar-24 | Lloyds Bank partnered with Taulia to offer Visa-enabled virtual payment cards to their corporate clients. This integration strengthens the bank’s working capital and supplier payment solutions, allowing businesses to leverage virtual card technology to optimize their cash flow and streamline electronic payment processing across their supply chains. |
| Amazon & U.S. Bank | Apr-24 | Amazon launched new business payment cards in partnership with U.S. Bank, expanding its commercial payment offerings for small and medium-sized enterprises. This development marks a strategic extension of Amazon’s financial services ecosystem, providing business customers with integrated credit and virtual payment tools designed to simplify purchasing and expense management. |
| Navan & American Express | Mar-24 | Navan and American Express launched a virtual card integration for corporate travel bookings. The solution enables the instant generation of secure virtual cards, allowing for streamlined expense management and improved visibility into corporate spending, which enhances operational efficiency for organizations managing complex travel and reimbursement workflows. |
Explore This Report
Click a section of the wheel — or its numbered marker — to preview the custom segmentation, custom table of contents, or related reports available for this market.
Virtual Cards Market — Custom Segments
| Segment | Sub-Segment |
|---|---|
| No segment data available. | |
Virtual Cards Market — report.custom
| Custom Chapter | Custom Details | ||
|---|---|---|---|
| No custom TOC data available. | |||
Need a different cut of the data?
Request Custom ResearchWhat is the current size of the virtual cards market?
What is the projected value of the virtual cards industry by 2035?
How is the growth of digital payments accelerating adoption in the virtual cards market?
Why is tokenization strengthening the commercial adoption of virtual cards?
Why does business use dominate the virtual cards market?
Which card type is expanding the fastest in the virtual cards market?
Why does Europe lead the virtual cards market?
What is driving Asia Pacific growth in virtual cards adoption?
Who are the leading players in the virtual cards landscape?
Our Clients
"The reports offered a comprehensive view of the Food and Beverage landscape, covering market trends, consumer behavior, and competitive dynamics."
"Our experience in acquiring market research reports has been outstanding — the depth of analysis and actionable insights have proven invaluable."
"Fundamental Business Insights demonstrated a keen understanding of our business needs, delivering reports tailored to our specific objectives."
Our Research Team & Methodology
Every Fundamental Business Insights report is built by a dedicated vertical research team, validated through a structured primary-and-secondary methodology, and reviewed for accuracy before it reaches you.
Research Team Overview
Prepared by the Smart Technologies Research Team
Delivery
Published
Demand
Available
Support
Trust & Compliance
Research Domains
10 coverage areasResearch Intelligence
| Source Category | Research Sources | Purpose |
|---|---|---|
| Government Publications | Government agencies, statistical departments, regulatory bodies | Industry statistics, regulatory insights, and policy analysis |
| Company Disclosures | Annual reports, investor presentations, financial filings | Company performance, business strategy, and market positioning |
| Trade Associations | Industry associations and professional organizations | Industry developments, standards, and market perspectives |
| Technical Literature | Research papers, technical publications, academic journals | Technology developments and technical validation |
| Patent Analysis | Patent databases and intellectual property publications | Innovation trends, technology activity, and competitive research |
| Industry Databases | Established research databases and market intelligence resources | Market benchmarking, historical data, and industry analysis |
Research Workflow & Quality Assurance
Data Collection
Verified information gathered through primary and secondary research.
Data Triangulation
Cross-validation using multiple independent data sources.
Forecast Modelling
Market estimates developed using historical trends and analytical models.
Analyst Validation
Findings reviewed by domain experts for accuracy and consistency.
Editorial & Quality Review
Final editorial, quality, and compliance checks before publication.
Final Publication
Released after successful completion of the internal review process.
Report Coverage
📊 Market Assessment
- Market Size & Forecast
- Market Segmentation
- Regional Analysis
- Growth Drivers & Challenges
- Market Dynamics
🏢 Competitive Intelligence
- Competitive Landscape
- Company Profiles
- Competitive Benchmarking
- Mergers & Acquisitions
- Market Share Analysis or Key Company Strategies
🔍 Strategic Analysis
- Value Chain Analysis
- Porter's Five Forces
- PESTLE Analysis
- Pricing Trends
- Supply-Demand Analysis
🚀 Future Outlook
- Technology Landscape
- Regulatory Landscape
- Investment & Funding Landscape
- Emerging Opportunities
- Future Market Outlook
Have a question about this report or need a custom scope?
Request Customization