Virtual Pipeline Market Size & Growth Forecast 2027–2036, By Segments (End Use, Mode of Transportation, Fuel), Regional Demand Trends (North America, Asia Pacific, Europe), Key Country Insights (U.S., Japan, South Korea, Germany, France, Italy), and Competitive Landscape
Market Size and Growth Outlook
Virtual Pipeline Market size was worth USD 2.66 Billion in 2026 and is expected to grow at 6.15% CAGR between 2027 and 2036, reaching USD 4.83 Billion by 2036. The industry revenue for 2027 is assessed at USD 2.8 Billion.
Get more details on this report
Request Free Sample ReportVirtual Pipeline Market Intelligence Snapshot
Regional Market Dynamics
- Europe led in 2026 as energy security, gas supply diversification, and demand from locations without viable conventional pipelines support flexible gas delivery.
- Asia Pacific is the fastest-growing region, fueled by industrialization, rising energy demand, cleaner-fuel investment, and expanding gas access in underserved areas.
Segment Momentum
- CNG was the largest fuel segment in 2026 because it is widely used as a cleaner alternative fuel and provides a practical solution for supplying natural gas to areas without pipeline infrastructure.
- LNG is expected to record the fastest growth due to its higher energy density, efficient long-distance transportation capabilities, and increasing demand for flexible and reliable cleaner fuel distribution.
Market Expansion Drivers
- Expanding remote industrial gas supply needs driving virtual pipeline adoption
- Rising LNG distribution flexibility requirements boosting mobile gas transport solutions
- Infrastructure constraints in remote regions increasing off-grid energy logistics demand
Leading Market Participants
- Prominent players in the virtual pipeline market include Kinder Morgan, Inc. (United States), Stabilis Solutions, Inc. (United States), Hexagon Agility (United States), Air Products and Chemicals, Inc. (United States), Aggreko plc (United Kingdom), Snam S.p.A. (Italy), Petroliam Nasional Berhad (PETRONAS) (Malaysia), NG Advantage LLC (United States), Galileo Technologies S.A. (Argentina), Xpress Natural Gas LLC (United States)
Global Market Forecast Snapshot
Market Outlook
- 2026 Market Size: USD 2.66 Billion
- 2027 Estimated Market Size: USD 2.8 Billion
- Projected Market Size: USD 4.83 Billion by 2036
- Growth Forecast: 6.15% CAGR (2027-2036)
Regional and Segment Outlook
- Leading Regional Market: Europe
- High-Growth Regional Hub: Asia Pacific
- Core Revenue Segment: Industrial (End Use) | Truck (Mode of Transportation) | CNG (Fuel)
- Emerging Opportunity Segment: Industrial (End Use) | Truck (Mode of Transportation) | LNG (Fuel)
Market Growth Drivers and Industry Trends
Expanding remote industrial gas supply needs driving virtual pipeline adoption
Industrial operations located far from conventional pipeline infrastructure are increasingly seeking dependable alternatives for the transportation of natural gas and industrial gases, creating favorable conditions for the virtual pipeline market. Mining sites, manufacturing facilities, power generation plants, and other remote operations require uninterrupted fuel supply to maintain productivity, making mobile gas delivery systems an attractive solution. Virtual pipeline networks enable compressed or liquefied gas to be transported by specialized trailers, reducing dependence on costly fixed infrastructure while improving supply flexibility. This approach also allows industrial users to expand operations in underserved locations without waiting for permanent pipeline construction or extensive utility network development.
Rising LNG distribution flexibility requirements boosting mobile gas transport solutions
The growing need for flexible liquefied natural gas distribution across diverse end-user locations will propel the virtual pipeline market growth as energy suppliers prioritize efficient transportation models that can adapt to changing consumption patterns. Mobile LNG transport solutions allow distributors to serve industrial facilities, commercial users, and regional energy networks through scalable delivery schedules without requiring continuous pipeline connectivity. This flexibility supports seasonal demand variations, temporary energy requirements, and emerging industrial projects while enabling suppliers to optimize logistics and improve asset utilization. The ability to rapidly redirect gas deliveries according to operational needs strengthens the role of virtual pipeline systems within modern energy distribution strategies.
Infrastructure constraints in remote regions increasing off-grid energy logistics demand
Limited pipeline infrastructure across isolated and geographically challenging regions is strengthening demand for alternative energy transportation systems, driving wider adoption across the virtual pipeline market. Many remote communities and industrial developments face significant barriers to conventional pipeline construction due to terrain, investment requirements, and extended project timelines. Virtual pipeline solutions provide an effective means of delivering reliable gas supplies through road-based transportation, supporting off-grid energy applications where permanent infrastructure is economically impractical. These systems also improve energy accessibility for developing industrial clusters and decentralized facilities by enabling consistent fuel availability without extensive network expansion.
| Growth Driver | Impact on CAGR | Regulatory Influence | Geographic Relevance | Adoption Rate | Impact Timeline |
|---|---|---|---|---|---|
| Expanding remote industrial gas supply needs driving virtual pipeline adoption | 1.9% | High | Asia Pacific, North America | High | Near Term |
| Rising LNG distribution flexibility requirements boosting mobile gas transport solutions | 1.8% | High | Europe, Asia Pacific | High | Mid Term |
| Infrastructure constraints in remote regions increasing off-grid energy logistics demand | 1.7% | High | Latin America, Africa | Emerging | Mid Term |
Unlock insights tailored to your business with our bespoke market research solutions.
Click to get your customized report now.
Regional Demand Dynamics
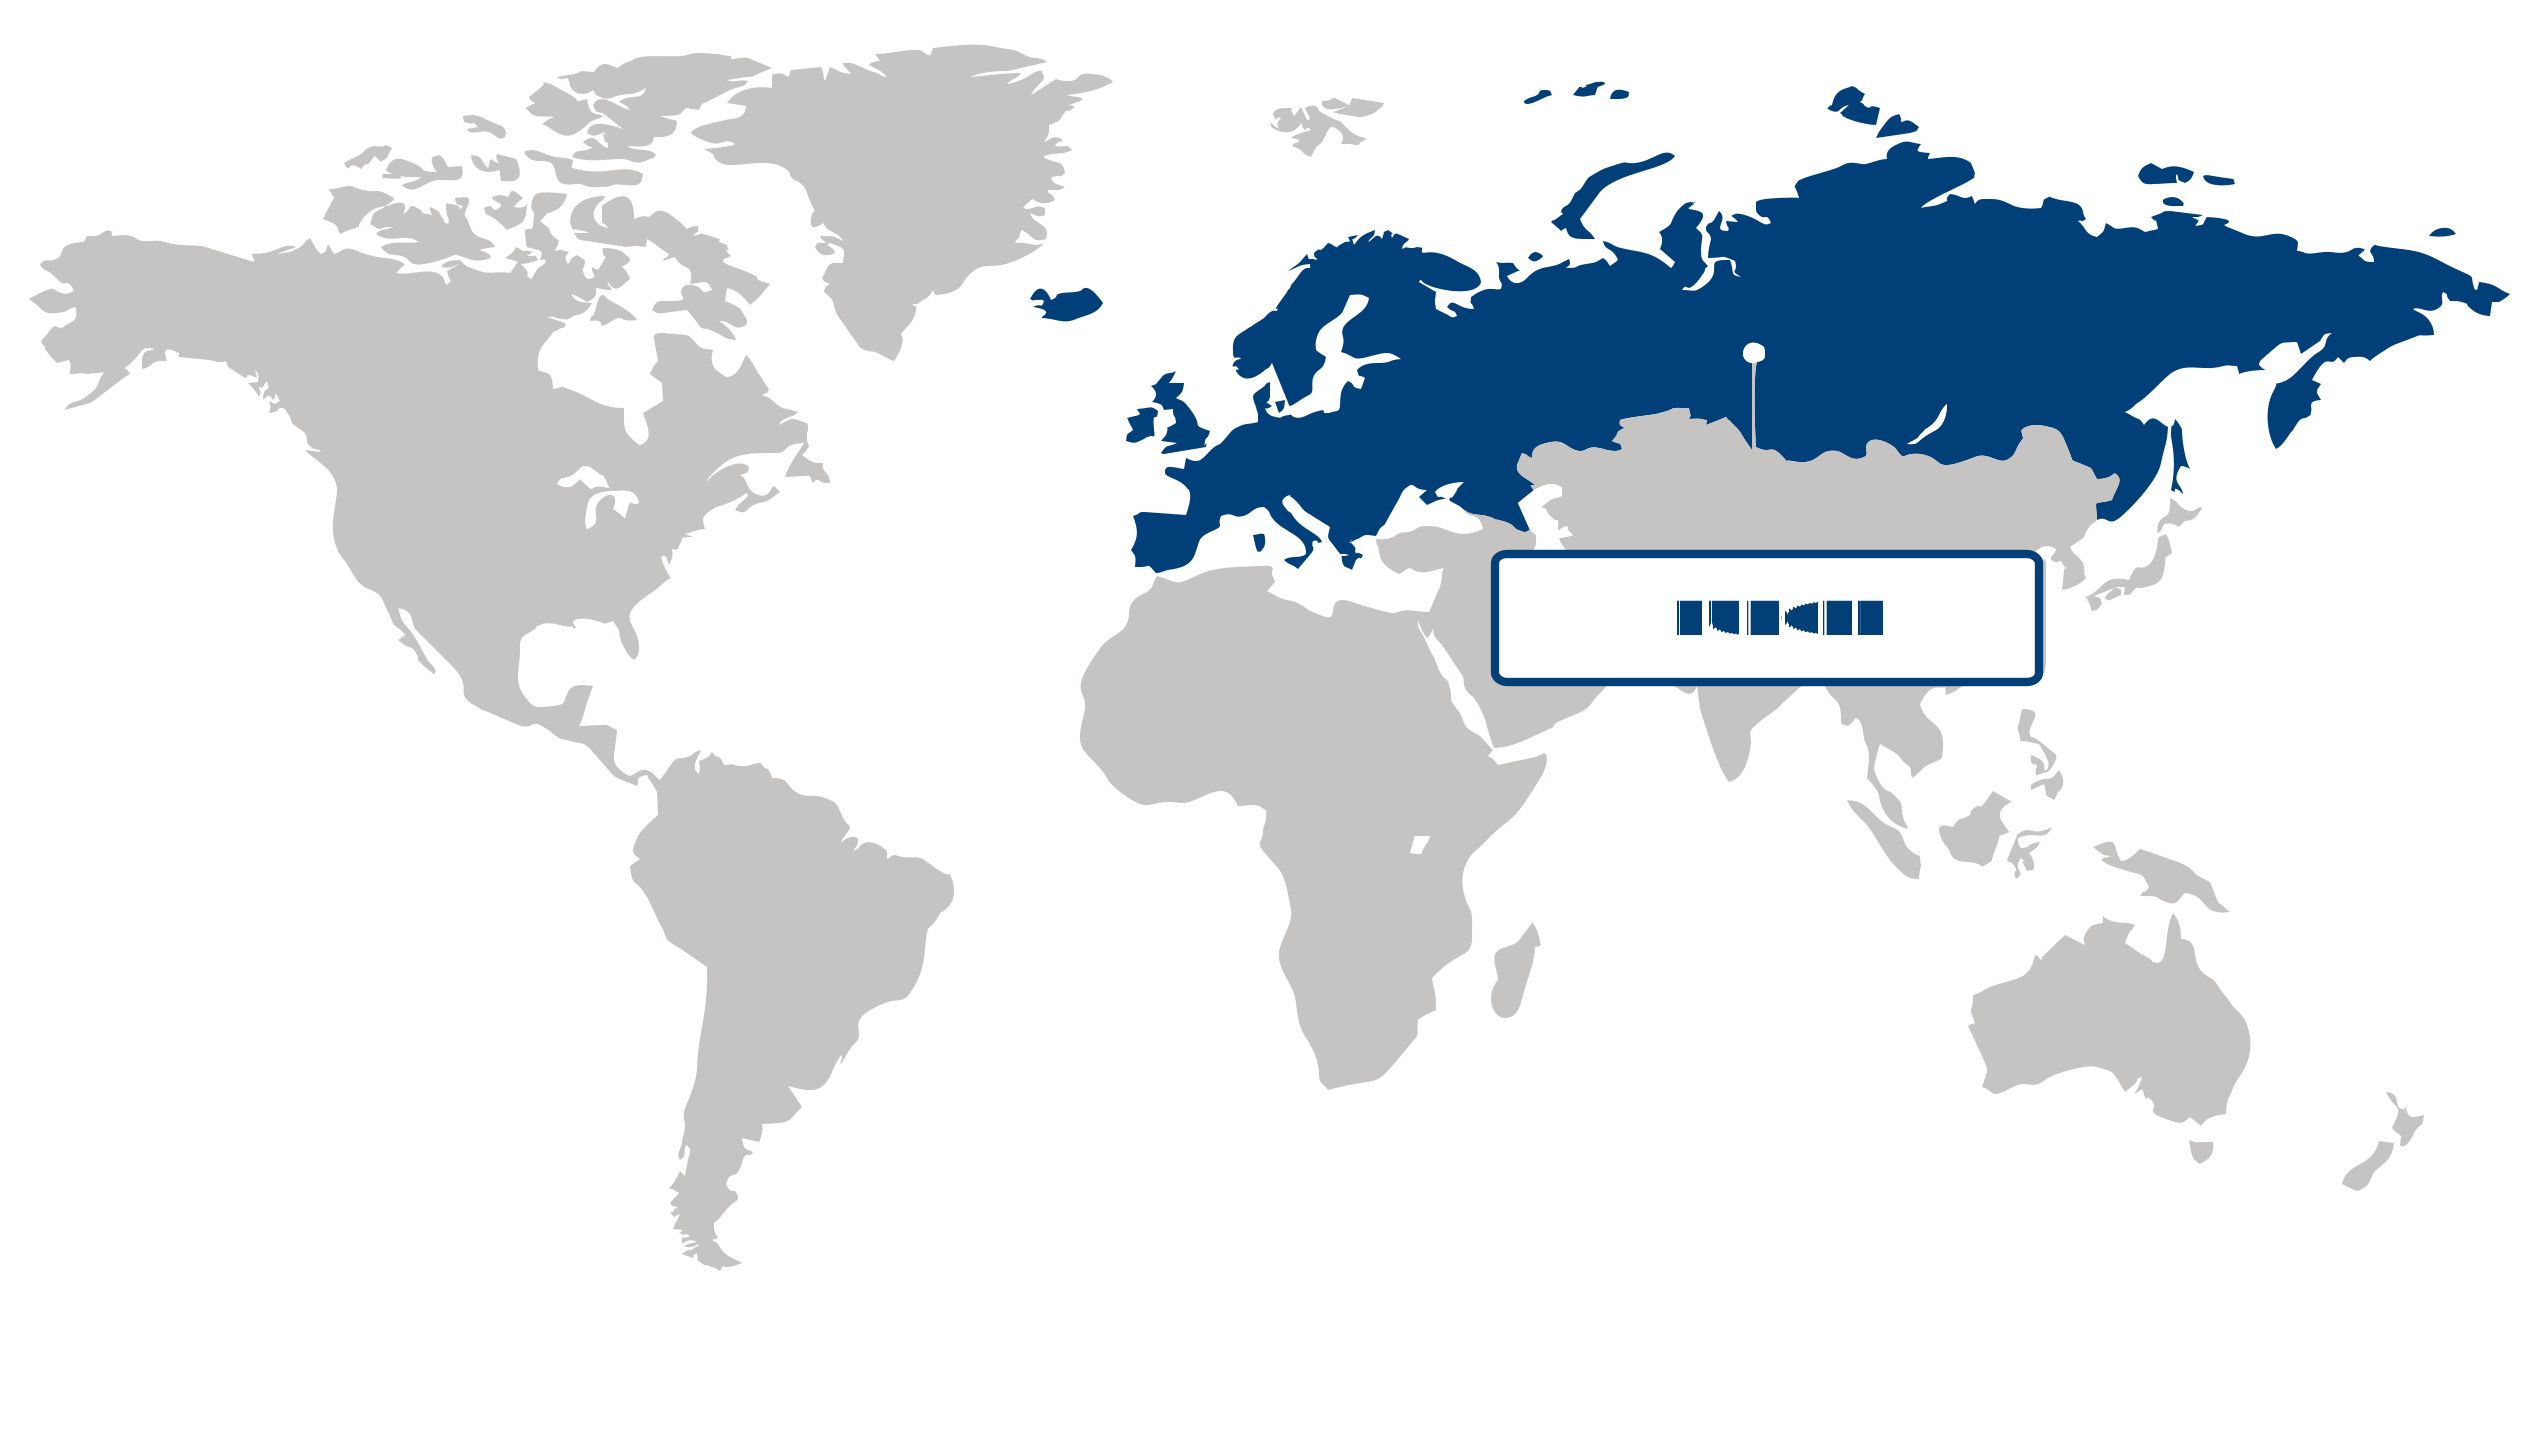
Europe (Largest Region)
Europe held the largest position in the virtual pipeline market in 2026, supported by the region's focus on energy security, diversification of gas supply, and the need to serve locations where conventional pipeline infrastructure is unavailable or economically difficult to extend. Virtual pipeline systems provide flexibility in transporting compressed or liquefied gas to remote industrial facilities, commercial users, and communities, making them valuable for decentralized energy distribution. Growing efforts to strengthen energy resilience and improve access to cleaner-burning fuels are also supporting demand, while industrial and infrastructure applications continue to create opportunities for mobile and flexible gas delivery solutions.
Asia Pacific (Fastest-Growing Region)
Asia Pacific is emerging as the fastest-growing region in the virtual pipeline market as industrialization, urbanization, and expanding energy demand increase the need for flexible gas distribution solutions. Remote industrial areas and locations with limited pipeline connectivity can benefit from virtual pipeline systems that provide access to natural gas without requiring extensive fixed infrastructure. Growing investment in cleaner energy sources, efforts to reduce reliance on more polluting fuels, and expanding industrial and commercial activity are further encouraging adoption. The ability to rapidly extend gas access to underserved locations is particularly relevant across developing economies with evolving energy infrastructure.
| Parameter | North America | Asia Pacific | Europe | Latin America | MEA |
|---|---|---|---|---|---|
| Innovation Hub i Scale Nascent Developing Advanced | |||||
| Cost-Sensitive Region i Scale Low Medium High | |||||
| Regulatory Environment i Scale Restrictive Neutral Supportive | |||||
| Demand Drivers i Scale Weak Moderate Strong | |||||
| Development Stage i Scale Emerging Developing Developed | |||||
| Adoption Rate i Scale Low Medium High | |||||
| New Entrants/Startups i Scale Low Medium High | |||||
| Macro Indicators i Scale Weak Stable Strong |
Key Country Insights
United States 🇺🇸
Flexible Gas DistributionThe U.S. expands virtual pipeline solutions to deliver natural gas and renewable fuels beyond conventional pipeline networks. Energy providers increasingly deploy compressed and liquefied gas transport systems to improve supply flexibility for industrial and commercial users.
Germany 🇩🇪
Decentralized Energy DeliveryGermany prioritizes virtual pipeline systems that improve access to cleaner fuels in locations lacking permanent gas infrastructure. German energy companies increasingly integrate mobile gas distribution with industrial decarbonization and energy security strategies.
Japan 🇯🇵
Secure Fuel LogisticsJapan emphasizes virtual pipeline networks that strengthen fuel supply reliability for industrial facilities and remote consumers. Japanese operators increasingly invest in efficient transport, storage, and distribution systems to enhance energy resilience.
South Korea 🇰🇷
Industrial Gas MobilitySouth Korea advances virtual pipeline deployment to support industrial gas distribution and diversified energy supply. Companies in South Korea increasingly adopt mobile gas delivery solutions that improve operational flexibility and infrastructure utilization.
France 🇫🇷
Alternative Energy DistributionFrance supports virtual pipeline development for efficient delivery of natural gas and renewable gaseous fuels. French energy providers increasingly focus on transport solutions that extend fuel availability while reducing dependence on fixed pipeline infrastructure.
Italy 🇮🇹
Regional Supply NetworksItaly prioritizes virtual pipeline systems that connect underserved industrial and commercial users with reliable gas supplies. Italian energy companies increasingly optimize transport logistics and storage capabilities to improve distribution efficiency across regional markets.
Segment Leadership and Growth Trends
Virtual Pipeline Market Share (%), by End Use, 2026
Go beyond the chart, access full insights & data tables
Request Free Sample ReportEnd Use Segment Analysis: Industrial (Largest & Fastest-Growing Segment)
Industrial segment dominated the virtual pipeline market in 2026 and also represented the fastest-growing segment, driven by the increasing requirement for flexible and reliable energy transportation solutions across industrial facilities. Virtual pipeline systems enable the delivery of natural gas and other energy sources to locations where traditional pipeline infrastructure may not be practical or economically viable. The growing focus on cleaner energy utilization, operational efficiency, and dependable fuel supply for industrial operations is supporting the adoption of virtual pipeline solutions.
Mode of Transportation Segment Analysis: Truck (Largest & Fastest-Growing Segment)
Truck segment led the virtual pipeline market in 2026 and also emerged as the fastest-growing segment due to its flexibility, accessibility, and ability to support energy distribution across diverse locations. Truck-based transportation provides an efficient solution for delivering compressed or liquefied fuels to areas with limited pipeline connectivity. The adaptability of trucking networks, ease of deployment, and suitability for short- and medium-distance fuel transportation are contributing to the segment’s strong market position.
Fuel Segment Analysis: CNG (Largest Segment) vs LNG (Fastest-Growing Segment)
CNG segment accounted for the largest share of the virtual pipeline market in 2026, supported by its established use as a cleaner alternative fuel and its suitability for distributed energy supply applications. CNG-based virtual pipelines provide a practical solution for transporting natural gas to areas lacking direct pipeline access while supporting industrial and commercial energy requirements. The availability of supporting infrastructure and operational familiarity continue to strengthen demand for CNG applications.
LNG segment is experiencing faster growth as increasing demand for higher energy-density fuel transportation solutions encourages adoption across various applications. LNG enables efficient transportation over longer distances and supports energy supply flexibility for regions requiring alternative gas delivery methods. The growing emphasis on cleaner fuels and expanding requirements for reliable energy distribution are contributing to increased interest in LNG-based virtual pipeline systems.
| Segment | Sub-Segment | Largest Segment | Fastest Growing |
|---|---|---|---|
| End Use | Commercial, Industrial, Transportation | Industrial | Industrial |
| Mode of Transportation | Truck, Rail, Ship, Barge | Truck | Truck |
| Fuel | CNG, LNG, Others | CNG | LNG |
Competitive Landscape and Market Positioning
Prominent players in the virtual pipeline market:
- Kinder Morgan, Inc. (United States)
- Stabilis Solutions, Inc. (United States)
- Hexagon Agility (United States)
- Air Products and Chemicals, Inc. (United States)
- Aggreko plc (United Kingdom)
- Snam S.p.A. (Italy)
- Petroliam Nasional Berhad (PETRONAS) (Malaysia)
- NG Advantage LLC (United States)
- Galileo Technologies S.A. (Argentina)
- Xpress Natural Gas LLC (United States)
Market participants are broadening competition by expanding beyond conventional gas transportation services toward integrated delivery models capable of serving diverse industrial, commercial, and remote energy applications. Greater emphasis is being placed on logistics optimization, storage flexibility, and reliable supply coordination, reflecting customer demand for dependable energy access in locations lacking permanent pipeline infrastructure. Differentiation is also emerging through advancements in transport equipment, digital fleet monitoring, and operational efficiency, enabling suppliers to improve service responsiveness while adapting to changing regulatory expectations and evolving fuel preferences across regional markets.
| Company | Market Share | Company Revenue | Revenue CAGR (%) | Product Portfolio | Geographic Presence | Innovation / R&D Focus | Strategic Developments |
|---|---|---|---|---|---|---|---|
| Kinder Morgan Inc. (United States) | |||||||
| Stabilis Solutions Inc. (United States) | |||||||
| Hexagon Agility (United States) | |||||||
| Air Products and Chemicals Inc. (United States) | |||||||
| Aggreko plc (United Kingdom) | |||||||
| Snam S.p.A. (Italy) | |||||||
| Petroliam Nasional Berhad (PETRONAS) (Malaysia) | |||||||
| NG Advantage LLC (United States) | |||||||
| Galileo Technologies S.A. (Argentina) | |||||||
| Xpress Natural Gas LLC (United States) |
Industry Development/News
| Company Name | Date | Key Development |
|---|---|---|
| U.S. Trade and Development Agency (USTDA) | Jul-26 | The USTDA funded a comprehensive feasibility study for a small-scale LNG facility in Nigeria. The project evaluates decentralized gas delivery infrastructure designed to supply remote industrial end-users and communities through a flexible virtual pipeline LNG distribution network. |
| Portland Gas Limited | May-26 | Portland Gas Limited, in partnership with Nigeria’s Midstream and Downstream Gas Infrastructure Fund, successfully commissioned a 96,000 Standard Cubic Metres capacity compressed natural gas daughter station, scaling up regional cleaner gas virtual distribution infrastructure. |
| PT Likuid Nusantara Gas | Feb-26 | PT Likuid Nusantara Gas inaugurated Indonesia's inaugural modular micro LNG facility utilizing Galileo Technologies' proprietary Cryobox technology. The deployment establishes localized, highly scalable modular LNG infrastructure optimized for flexible gas supply applications in underserved regions. |
| Sarawak Energy | Dec-25 | Sarawak Energy announced that its proprietary Virtual Pipeline System, designed to transport LNG from Bintulu to Kuching, is scheduled to commence commercial operations in Q1 2026, establishing a major new regional gas supply network. |
| Endurance Group | Nov-25 | Endurance Group entered a strategic partnership with Nigeria’s Midstream and Downstream Gas Infrastructure Fund to construct 500 compressed natural gas refueling stations nationwide by 2028, driving significant structural expansion of the country's downstream CNG distribution footprint. |
| NNPC Gas Marketing Limited | Apr-25 | NNPC Gas Marketing Limited acquired a 15% equity stake in Starzs Gas Limited’s compressed natural gas facility in Delta State. The transaction strengthens the company's financial and operational participation in decentralized CNG processing and downstream distribution networks. |
| Naturgy | Sep-24 | Naturgy partnered with biomethane developer CycleØ to launch Spain’s first virtual gas pipeline system. The operational model enables the distribution of renewable gas to off-grid industrial locations lacking direct connection to traditional pipeline infrastructure. |
| Gas Malaysia Green Ventures | Apr-24 | Gas Malaysia Green Ventures finalized a collaboration agreement with FGV Palm Industries to acquire purified biogas for conversion into biomethane, securing commercial feedstock supplies to support alternative renewable gas virtual pipeline networks. |
| Kinder Morgan | Aug-22 | Kinder Morgan acquired North American Natural Resources, Inc. and North American BiofueLLC for USD 135 million, investing an additional USD 175 million to convert power plants in Michigan and Kentucky into renewable natural gas facilities, substantially advancing its sustainable distribution infrastructure and supply capabilities. |
| Petronas | Sep-20 | Petronas commercialized its customer-centric Virtual Pipeline System solution via its Peninsular Malaysia Regasification Terminal. Managed through PETRONAS Dagangan Berhad, the system utilizes specialized cryogenic trucks to deliver liquefied natural gas directly to off-grid industrial consumers. |
Customize Your Report
Explore examples of how this report can be tailored to different research needs, including custom segments, additional topics or chapters, and related reports. Click a section of the wheel or its numbered marker to explore the available options.
Virtual Pipeline Market — Custom Segments
| Segment | Sub-Segment |
|---|---|
| Supply Source | Natural Gas Production Fields, Gas Processing & Transmission Networks, LNG Terminals, Renewable Gas Sources |
| Customer Contract Model | Long-Term Contracts, Short-Term Contracts, Spot & On-Demand Supply, Take-or-Pay Contracts |
| Gas Demand Profile | Base-Load Demand, Seasonal Demand, Peak/Backup Demand, Emergency & Temporary Demand |
Virtual Pipeline Market — Custom
| Custom Chapter | Custom Details |
|---|---|
| Off-Grid Gas Supply Opportunity Mapping |
|
| Virtual Pipeline Deployment Economics |
|
| Industrial Fuel Switching Potential |
|
Need a different cut of the data?
Request Custom ResearchHow big is the virtual pipeline market?
What is the expected industry size of virtual pipeline by 2036?
How are remote industrial operations reshaping virtual pipeline demand?
Why is distribution flexibility becoming strategically important in the virtual pipeline market?
Why is CNG the leading fuel segment in the virtual pipeline market?
Which fuel segment is expected to grow the fastest in the virtual pipeline market?
Why does Europe lead the virtual pipeline market?
How is Asia Pacific driving virtual pipeline market growth?
Who are the major participants shaping the virtual pipeline landscape?
Our Clients
"The reports offered a comprehensive view of the Food and Beverage landscape, covering market trends, consumer behavior, and competitive dynamics."
"Our experience in acquiring market research reports has been outstanding — the depth of analysis and actionable insights have proven invaluable."
"Fundamental Business Insights demonstrated a keen understanding of our business needs, delivering reports tailored to our specific objectives."
Our Research Team & Methodology
Every Fundamental Business Insights report is built by a dedicated vertical research team, validated through a structured primary-and-secondary methodology, and reviewed for accuracy before it reaches you.
Research Team Overview
Prepared by the Energy & Power Research Team
Delivery
Published
Demand
Available
Support
Trust & Compliance
Research Domains
10 coverage areasResearch Intelligence
Research Workflow & Quality Assurance
Data Collection
Verified information gathered through primary and secondary research.
Data Triangulation
Cross-validation using multiple independent data sources.
Forecast Modelling
Market estimates developed using historical trends and analytical models.
Analyst Validation
Findings reviewed by domain experts for accuracy and consistency.
Editorial & Quality Review
Final editorial, quality, and compliance checks before publication.
Final Publication
Released after successful completion of the internal review process.
Report Coverage
📊 Market Assessment
- Market Size & Forecast
- Market Segmentation
- Regional Analysis
- Growth Drivers & Challenges
- Market Dynamics
🏢 Competitive Intelligence
- Competitive Landscape
- Company Profiles
- Competitive Benchmarking
- Mergers & Acquisitions
- Market Share Analysis or Key Company Strategies
🔍 Strategic Analysis
- Value Chain Analysis
- Porter's Five Forces
- PESTLE Analysis
- Pricing Trends
- Supply-Demand Analysis
🚀 Future Outlook
- Technology Landscape
- Regulatory Landscape
- Investment & Funding Landscape
- Emerging Opportunities
- Future Market Outlook
Have a question about this report or need a custom scope?
Request Customization